 Back
BackCollege Algebra Practice Problems – Step-by-Step Guidance
Study Guide - Smart Notes
 Tailored notes based on your materials, expanded with key definitions, examples, and context.
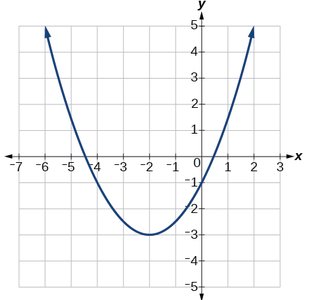
Q7. Use the graph of the given quadratic function to determine the sign of the leading coefficient a, the vertex, the axis of symmetry, the x-intercepts, the y-intercept, the intervals of increasing/decreasing, and the domain and range.
Background
Topic: Quadratic Functions and Their Graphs
This question tests your ability to interpret the graph of a quadratic function (a parabola) and extract key features such as the vertex, axis of symmetry, intercepts, intervals of increase/decrease, and domain/range.
Key Terms and Concepts:
Vertex: The turning point of the parabola (either maximum or minimum).
Axis of Symmetry: The vertical line that passes through the vertex and divides the parabola into two symmetric parts.
x-intercepts: Points where the graph crosses the x-axis.
y-intercept: Point where the graph crosses the y-axis.
Intervals of Increasing/Decreasing: Where the function values are rising or falling as x increases.
Domain: All possible x-values for the function.
Range: All possible y-values for the function.
Leading Coefficient (a): The coefficient of in the quadratic equation .
Step-by-Step Guidance
Observe the direction the parabola opens. If it opens upwards, the leading coefficient is positive; if it opens downwards, is negative.
Identify the vertex by finding the lowest or highest point on the graph. The vertex has coordinates .
Determine the axis of symmetry. This is the vertical line , where is the x-coordinate of the vertex.
Find the x-intercepts (if any) by locating where the graph crosses the x-axis. These are points where .
Find the y-intercept by locating where the graph crosses the y-axis (where ).
Try solving on your own before revealing the answer!
Final Answer:
Leading coefficient : Positive (parabola opens upwards)
Vertex:
Axis of symmetry:
x-intercepts:
y-intercept:
Intervals of increasing:
Intervals of decreasing:
Domain:
Range:
All features are determined by analyzing the graph and using the definitions above.
