 Back
BackCollege Algebra Study Guide: Chapter 2 – More on Functions
Study Guide - Smart Notes
 Tailored notes based on your materials, expanded with key definitions, examples, and context.
Family Functions & Their Characteristics
Graphing and Analyzing Functions
Understanding the characteristics of different types of functions is fundamental in college algebra. Functions are used to model real-world phenomena, and their graphs provide valuable information about their behavior.
Graphing Functions: Use technology, such as graphing calculators, to visualize functions and estimate intercepts, relative minima, and maxima.
Analyzing Graphs: Determine the domain (set of possible input values), range (set of possible output values), intercepts, intervals of increase/decrease, and extrema (maximum and minimum values).
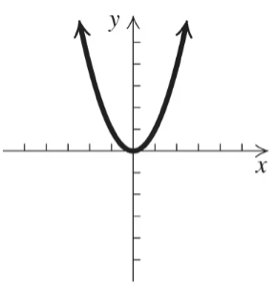
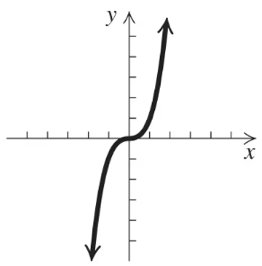
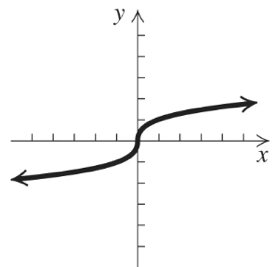
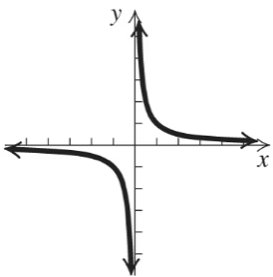
Function Families: Recognize the shapes and characteristics of linear, quadratic, square root, cubic, cube root, reciprocal, absolute value, exponential, and logarithmic functions.
Piecewise Functions: Graph and evaluate functions defined by different expressions over different intervals.
Zeros and Intercepts of Functions
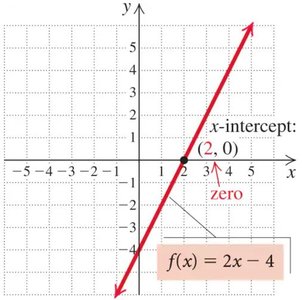
The zero of a function is the input value where the output is zero. This corresponds to the x-intercept of the graph, but while the zero is a value, the x-intercept is an ordered pair.
Finding Zeros: Set and solve for .
Example: For , the zero is .
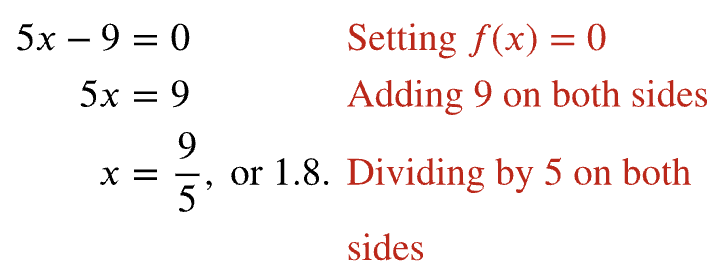
Algebraic and Graphical Solutions for Zeros
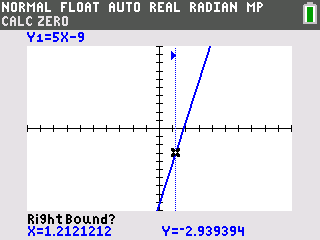
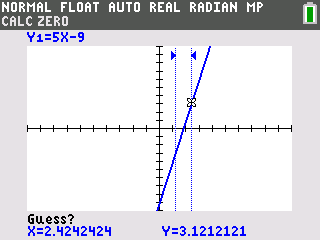
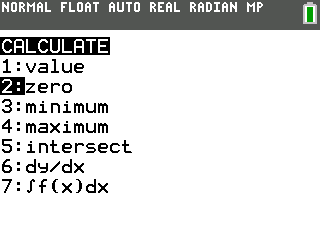
Zeros can be found algebraically by solving equations or graphically using calculators.
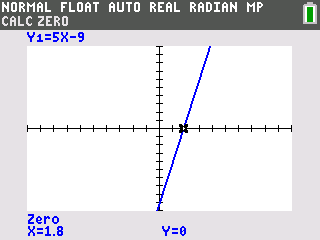
Algebraic Solution: Solve to get .
Graphical Solution: Use calculator features to estimate zeros.
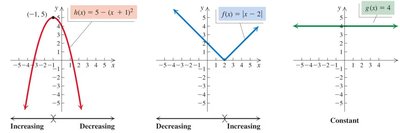
Increasing, Decreasing, and Constant Functions
Intervals of Behavior
A function can be increasing, decreasing, or constant over different intervals.
Increasing: The graph rises from left to right.
Decreasing: The graph falls from left to right.
Constant: The graph is flat; function values do not change.
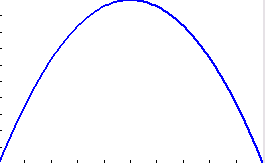
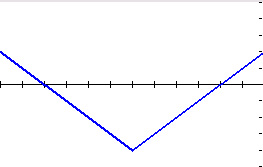
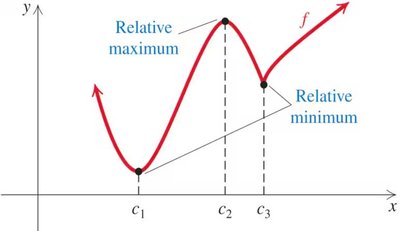
Relative Maximum and Minimum Values
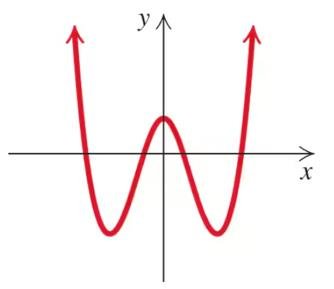
Relative extrema are points where the function changes direction.
Relative Maximum: The function changes from increasing to decreasing.
Relative Minimum: The function changes from decreasing to increasing.
Families of Functions
Basic Function Types
Functions are grouped by their equation forms and graph shapes. Transformations such as shifting, stretching, shrinking, and reflecting create new functions within the same family.
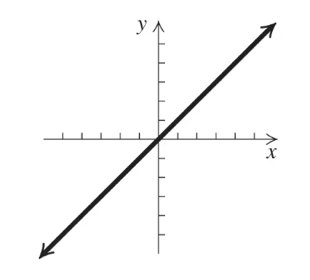
Linear:
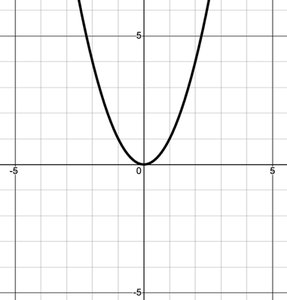
Quadratic:
Square Root:
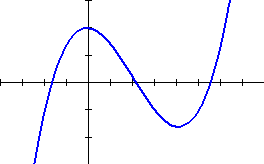
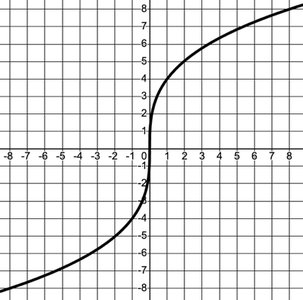
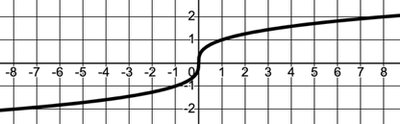
Cubic:
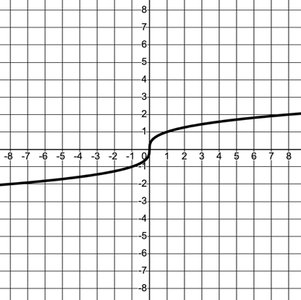
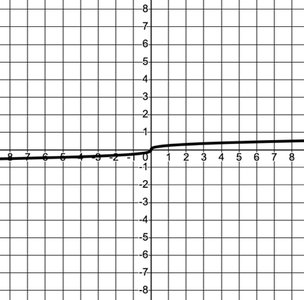
Cube Root:
Rational:
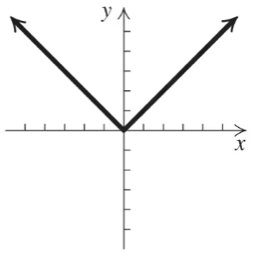
Absolute Value:
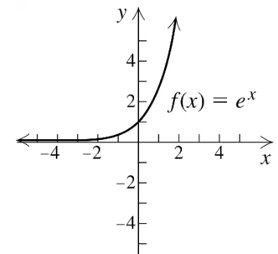
Exponential:
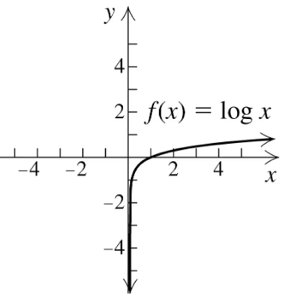
Logarithmic:
Piecewise Functions
Definition and Evaluation
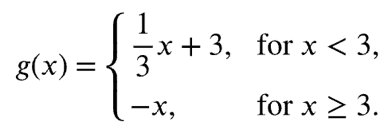
Piecewise functions use different formulas for different parts of the domain. Only one formula applies for any input value.
Example:
Evaluate by identifying which part of the domain the input belongs to.
Applications of Functions
Parking Costs (Piecewise Application)
Piecewise functions model real-world scenarios, such as parking costs that change based on time intervals.
Example: models cost for hours, with different rates for different intervals.
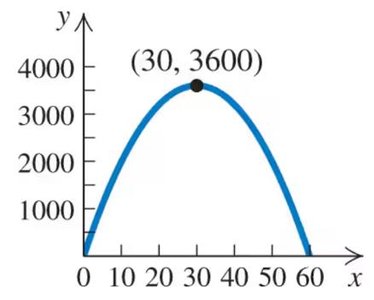
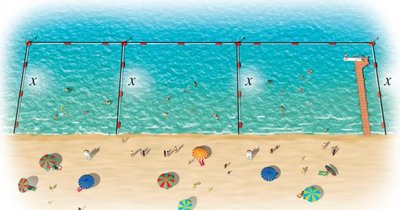
Swimming Area (Quadratic Application)
Functions can model geometric scenarios, such as maximizing the area of swimming zones with a fixed perimeter.
Example: Area as a function of width .
The Algebra & Composition of Functions
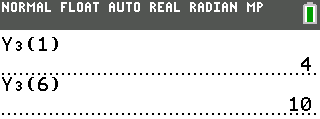
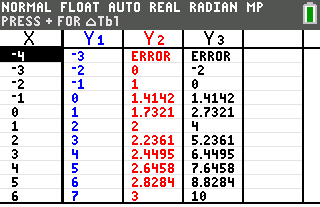
Combining Functions
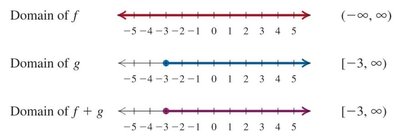
Functions can be combined using addition, subtraction, multiplication, and division. The domain of the resulting function is the intersection of the domains of the original functions.
Sum:
Difference:
Product:
Quotient: ,

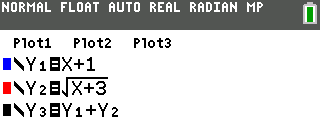
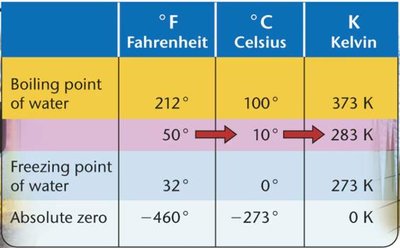
Composition of Functions
The composition of functions involves applying one function to the result of another. The domain of the composite function is determined by the domains of both functions.
Definition:
Example: Converting Fahrenheit to Kelvin:
Transformations of Functions
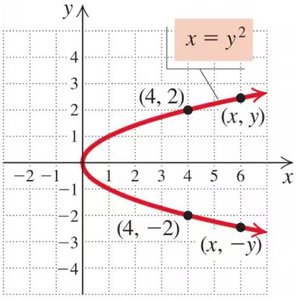
Symmetry
Graphs may exhibit symmetry with respect to the x-axis, y-axis, or origin.
x-axis Symmetry: If is on the graph, so is .
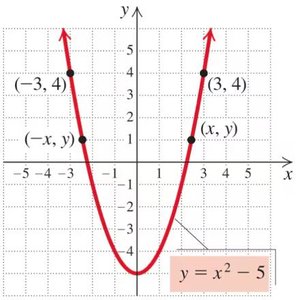
y-axis Symmetry: If is on the graph, so is .
Origin Symmetry: If is on the graph, so is .
Translations
Translations shift the graph horizontally or vertically.
Vertical: shifts up; shifts down.
Horizontal: shifts left; shifts right.

Reflections
Reflections flip the graph across the x-axis or y-axis.
x-axis:
y-axis:
Stretches and Shrinks
Stretching and shrinking change the shape of the graph vertically or horizontally.
Vertical: stretches for , shrinks for .
Horizontal: shrinks for , stretches for .
Variation
Direct, Inverse, and Combined Variation
Variation equations describe relationships where one variable changes directly, inversely, or jointly with another.
Direct Variation:
Inverse Variation:
Combined Variation: , , ,
Example: The flow rate of water from a fire hose varies directly with pump pressure and inversely with hose length : .
Solving Variation Problems:
Identify the type of variation.
Write the variation equation and solve for the constant using known values.
Use the equation to find unknown values.
