 Back
BackCollege Algebra Unit 2: Linear and Quadratic Functions (Sections 4.1, 4.3, 4.4)
Study Guide - Smart Notes
 Tailored notes based on your materials, expanded with key definitions, examples, and context.
Linear Functions
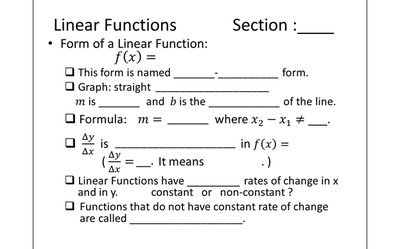
Definition and General Form
Linear functions are algebraic functions whose graphs are straight lines. They model relationships with a constant rate of change between two variables.
General Form:
Name: This is called the slope-intercept form.
Graph: The graph is a straight line where m is the slope and b is the y-intercept.
Slope Formula: , where .
Rate of Change: in is the slope. It means the change in per unit change in .
Constant Rate: Linear functions have a constant rate of change in and .
Nonlinear Functions: Functions that do not have a constant rate of change are called nonlinear functions.
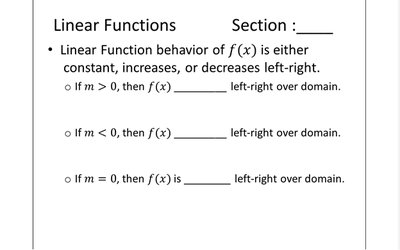
Behavior of Linear Functions
The behavior of a linear function depends on the value of the slope :
If , then increases left-to-right over its domain.
If , then decreases left-to-right over its domain.
If , then is constant left-to-right over its domain.
Identifying Linear vs. Nonlinear Functions from Data
To determine if a function is linear or nonlinear from a table of values, check if the rate of change () is constant. If so, the function is linear; otherwise, it is nonlinear.
x | y |
|---|---|
-1 | 4 |
0 | 5 |
1 | 9 |
2 | 18 |
x | y |
|---|---|
-3 | -4 |
-1 | 2 |
1 | 8 |
3 | 14 |
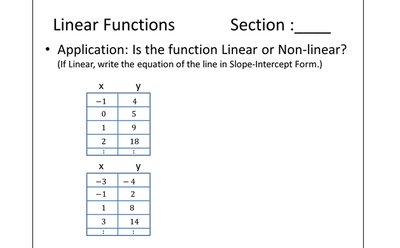
Example: For the second table, for each step, so the function is linear. The equation is .
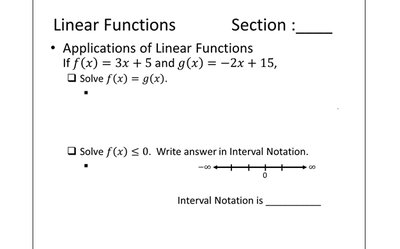
Applications of Linear Functions
Linear functions are used to model real-world relationships with constant rates of change. Common applications include cost, revenue, and depreciation problems.
Solving Equations: To find where two linear functions are equal, set and solve for .
Inequalities: To solve , solve for and express the solution in interval notation.
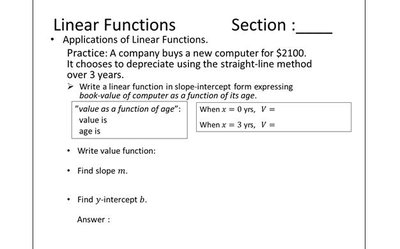
Depreciation Example
A company buys a computer for V(x)$ can be written in slope-intercept form:
When ,
When ,
Slope:
Value Function:
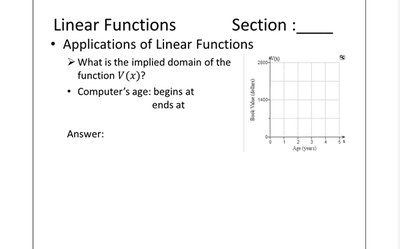
Domain of a Linear Model
The implied domain of is , since the computer's age cannot be negative or exceed 3 years.
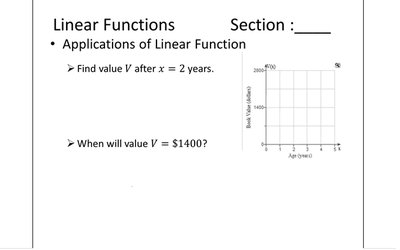
Evaluating and Solving Linear Models
To find after years:
To find when : year
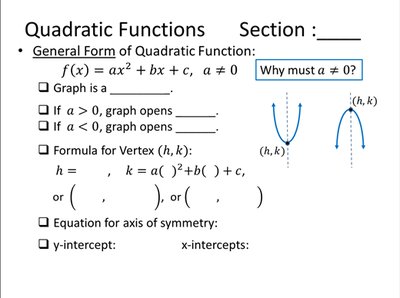
Quadratic Functions
General Form and Properties
Quadratic functions are polynomial functions of degree 2. Their graphs are parabolas, which open upward or downward depending on the leading coefficient.
General Form: ,
Graph: The graph is a parabola.
If , the parabola opens upward.
If , the parabola opens downward.
Vertex Formula: The vertex is given by ,
Axis of Symmetry:
y-intercept:
x-intercepts: Solve
Domain and Range
Domain: All real numbers,
Range: If , ; if ,
To find the range from a graph, read from the lowest to the highest point (bottom to top).
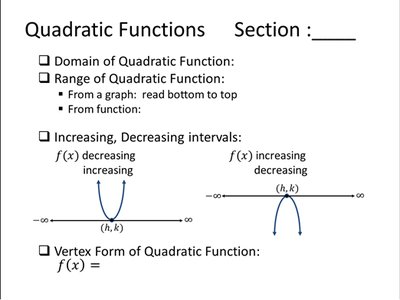
Increasing and Decreasing Intervals
For :
Decreasing on
Increasing on
Vertex Form of a Quadratic Function
The vertex form is , where is the vertex.
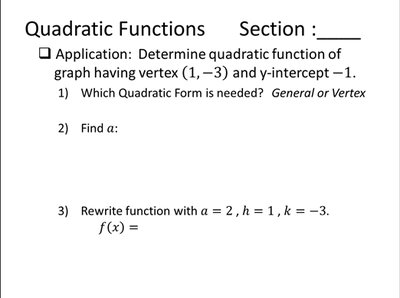
Applications of Quadratic Functions
Quadratic functions are used to model situations involving maximum or minimum values, such as projectile motion, area optimization, and revenue problems.
Example: Find a quadratic function with vertex and y-intercept .
Use vertex form:
Plug in , to solve for .
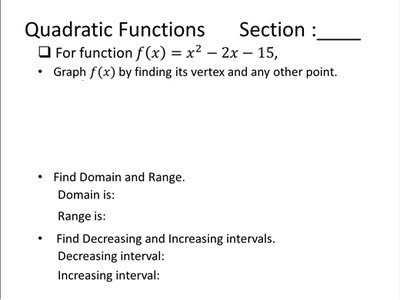
Graphing Quadratic Functions
To graph :
Find the vertex using
Find another point by substituting a value for
Determine domain, range, and intervals of increase/decrease
Building Quadratic Models
Translating Real-World Problems
Quadratic models are constructed by translating real-world scenarios into quadratic equations, then solving for optimal values (maximum or minimum).
Identify variables and relationships
Write the quadratic equation representing the situation
Find the vertex for optimal values
Applications of Quadratic Models
Fencing Problem: 2000 feet of fencing is used to enclose three sides of a rectangular field. Find the maximum area.
Revenue Problem: Given a demand equation , , express revenue as a function of and find the maximum revenue.
Suspension Bridge Problem: Find the height of cables at a certain distance from the center, given the parabolic shape of the cables.
Example (Revenue): If , the maximum revenue occurs at the vertex .
Solving Quadratic Models
Find the vertex to determine maximum or minimum values
Solve for or as required by the context
Express answers in appropriate units and context
Additional info: These notes cover the core concepts and applications of linear and quadratic functions, including modeling, graphing, and solving real-world problems, as outlined in a typical college algebra curriculum.
