 Back
BackComprehensive Study Notes: Introduction to Functions and Their Properties
Study Guide - Smart Notes
 Tailored notes based on your materials, expanded with key definitions, examples, and context.
Introduction to Functions
Relations and Functions
A relation is a set of ordered pairs, which can be represented as a list, a table, a graph, or an equation. The domain of a relation is the set of all permissible x-values (independent variable), and the range is the set of all permissible y-values (dependent variable).
Domain: All possible input values (x-values).
Range: All possible output values (y-values).
Relations can be discrete (individual points) or continuous (connected values).
Example: Find the domain and range of the relation {(-3, 5), (-5, 1), (4, 6), (7, 0)}.
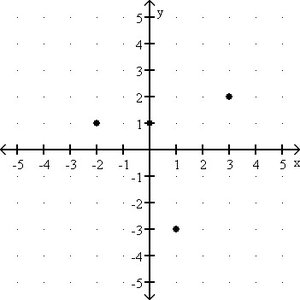
For discrete data, the domain and range are simply the sets of x- and y-values from the points.
Interval Notation
When data is continuous, domain and range are often expressed using interval notation. Intervals are written from least to greatest, using parentheses for endpoints not included and brackets for endpoints included.
Use ( ) for endpoints not included.
Use [ ] for endpoints included.
Definition of a Function
A function is a relation in which each x-value is assigned to exactly one y-value. This means that for every input, there is only one output.
All x-coordinates must be unique in a function.
Y-coordinates can repeat.
Example: {(2, 5), (-3, 7), (4, 5), (0, -1)} is a function, but {(1, 4), (6, 6), (1, -3), (7, 5)} is not, since x = 1 is paired with two different y-values.
Mapping Diagrams
Mapping diagrams visually represent relations and functions by showing how elements from one set (domain) are paired with elements from another set (range).
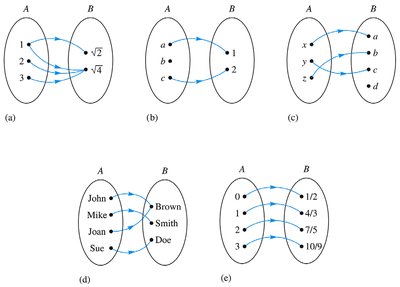
In a function, each element in the domain maps to only one element in the range.
One-to-One Correspondence
If a relation is a function from A to B and from B to A, it is called a one-to-one correspondence.
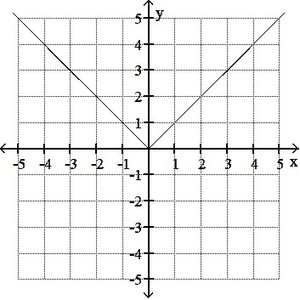
Vertical Line Test
The vertical line test is used to determine if a graph represents a function. If any vertical line intersects the graph at more than one point, the graph does not represent a function.
Function Notation
Functions are often written as f(x), which means "the value of function f at x." This is equivalent to y in the equation y = f(x).
Example: y = 2x + 1 can be written as f(x) = 2x + 1.
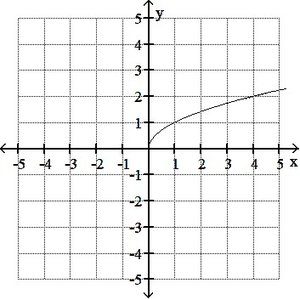
Evaluating Functions
To evaluate a function, substitute the given value for x and simplify.
Example: If g(x) = \sqrt{x-5}, then g(9) = \sqrt{9-5} = \sqrt{4} = 2.
Special Characteristics of Graphs
Increasing, Decreasing, and Constant Functions
A function is increasing on an interval if, as x increases, f(x) increases. It is decreasing if, as x increases, f(x) decreases. It is constant if f(x) remains the same as x increases.
To determine intervals, observe the graph and note where the function rises, falls, or stays flat.
Relative Maxima and Minima
A relative maximum is a point where the function value is higher than all nearby points. A relative minimum is a point where the function value is lower than all nearby points.
Tests for Symmetry
Graphs can be symmetric with respect to the y-axis, x-axis, or the origin.
Y-axis symmetry: For every (x, y), (-x, y) is also on the graph.
X-axis symmetry: For every (x, y), (x, -y) is also on the graph.
Origin symmetry: For every (x, y), (-x, -y) is also on the graph.
Even and Odd Functions
Even function: Symmetric with respect to the y-axis. f(-x) = f(x).
Odd function: Symmetric with respect to the origin. f(-x) = -f(x).
Piecewise Functions
Definition and Graphing
A piecewise function is defined by different expressions for different intervals of the domain. To graph, construct a table of values for each piece and plot accordingly, using open or closed circles at endpoints as appropriate.
The Difference Quotient
The difference quotient is used to find the average rate of change of a function and is defined as:
Transformations of Functions
Shifts
Shifts move the graph of a function horizontally or vertically.
Vertical shift: y = f(x) + c shifts up by c units; y = f(x) - c shifts down by c units.
Horizontal shift: y = f(x - c) shifts right by c units; y = f(x + c) shifts left by c units.
Reflections
Vertical reflection: y = -f(x) reflects the graph about the x-axis.
Horizontal reflection: y = f(-x) reflects the graph about the y-axis.
Stretching and Shrinking
Vertical stretch/shrink: y = c f(x) stretches if c > 1, shrinks if 0 < c < 1.
Horizontal stretch/shrink: y = f(cx) shrinks if c > 1, stretches if 0 < c < 1.
Order of Transformations
Horizontal shifts
Stretching/Shrinking
Reflections
Vertical shifts
Combinations of Functions
Operations
Sum: (f + g)(x) = f(x) + g(x)
Difference: (f - g)(x) = f(x) - g(x)
Product: (f * g)(x) = f(x) * g(x)
Quotient: (f / g)(x) = f(x) / g(x), g(x) ≠ 0
The domain of the new function is the intersection of the domains of the original functions, with additional restrictions for division (denominator ≠ 0).
Composition of Functions
The composition of functions is denoted (f ◦ g)(x) = f(g(x)). The domain consists of all x in the domain of g such that g(x) is in the domain of f.
Inverse Functions
Definition
Two functions f and g are inverses if f(g(x)) = x for every x in the domain of g, and g(f(x)) = x for every x in the domain of f. The inverse of f is denoted f-1.
The domain of f = range of f-1
The range of f = domain of f-1
Finding the Inverse
Replace f(x) with y.
Switch x and y.
Solve for y.
Replace y with f-1(x).
Graphical Interpretation
The graph of an inverse function is the reflection of the original function across the line y = x.
Horizontal Line Test: A function has an inverse if and only if it passes the horizontal line test (no horizontal line intersects the graph more than once).
Example: Show that f(x) = 4x - 7 and g(x) = (x + 7)/4 are inverses by verifying f(g(x)) = x and g(f(x)) = x.
Additional info: These notes cover the foundational concepts of functions, including their definitions, properties, graphical representations, and operations, as well as the construction and interpretation of inverse and piecewise functions, all of which are central to college algebra.
