 Back
BackGraphing a Linear Equation: Movable Bridge Height
Study Guide - Smart Notes
 Tailored notes based on your materials, expanded with key definitions, examples, and context.
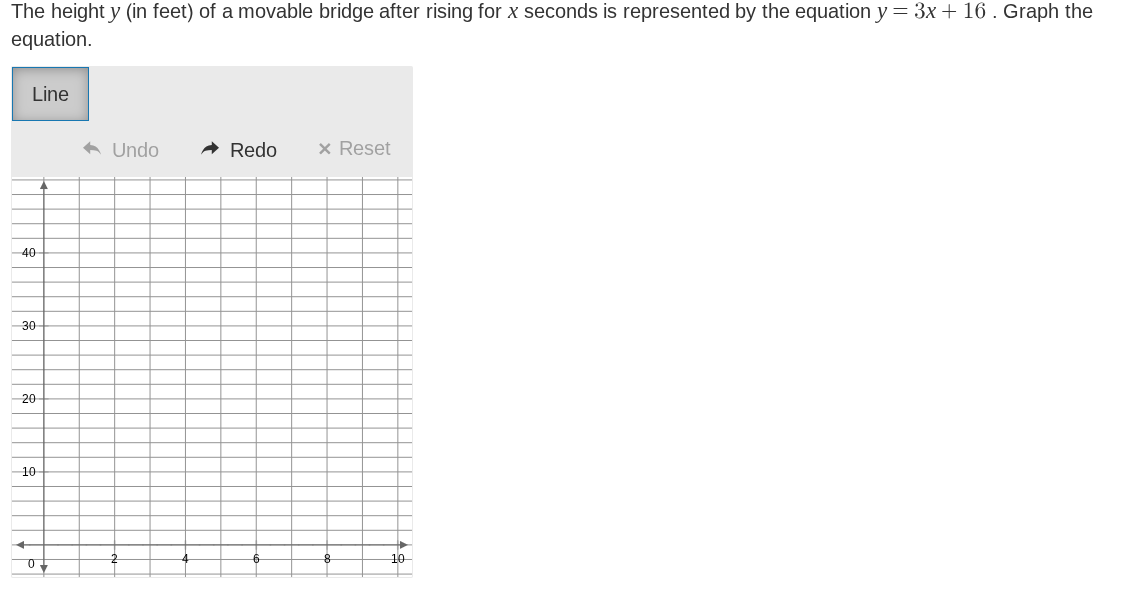
Q1. The height y (in feet) of a movable bridge after rising for x seconds is represented by the equation y = 3x + 16. Graph the equation.
Background
Topic: Graphing Linear Equations
This question tests your understanding of how to graph a linear equation in slope-intercept form, which is a foundational concept in college algebra. The equation models a real-world scenario where the height of a bridge increases over time.
Key Terms and Formulas
Slope-intercept form:
Slope (m): The rate of change; here, (the bridge rises 3 feet per second).
y-intercept (b): The starting value when ; here, (the initial height of the bridge).
Step-by-Step Guidance
Identify the slope and y-intercept from the equation . Here, the slope and the y-intercept .
Plot the y-intercept on the graph. This is the point , where the bridge starts at 16 feet when seconds.
Use the slope to find another point. Since the slope is 3, for every 1 unit you move to the right (increase by 1), move up 3 units (increase by 3). So, from , the next point is .
Draw a straight line through these points to represent the equation. Extend the line in both directions, making sure it follows the pattern set by the slope.
Try solving on your own before revealing the answer!
Final Answer: The graph is a straight line with y-intercept at (0, 16) and slope 3.
Plot the point (0, 16), then from there, go right 1 and up 3 to plot (1, 19). Draw a straight line through these points. This line represents the equation .
