 Back
BackGraphs and Functions: Rectangular Coordinates, Relations, and Basic Function Concepts
Study Guide - Smart Notes
 Tailored notes based on your materials, expanded with key definitions, examples, and context.
Rectangular Coordinates and Graphs
Ordered Pairs
In mathematics, an ordered pair is a pair of elements written in a specific order, usually as (x, y). Ordered pairs are used to represent points in the coordinate plane, where the first element is the x-coordinate and the second is the y-coordinate.
Key Point: Ordered pairs express relationships between two quantities, such as categories and amounts spent.
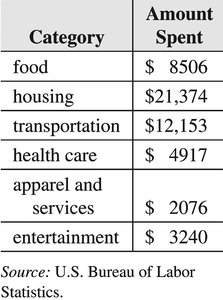
Example: The table below shows categories of spending and the corresponding amounts, which can be written as ordered pairs (category, amount).
Category | Amount Spent |
|---|---|
food | $8,506 |
housing | $21,374 |
transportation | $12,153 |
health care | $4,917 |
apparel and services | $2,076 |
entertainment | $3,240 |
The Rectangular Coordinate System
The rectangular coordinate system (also called the Cartesian coordinate system) consists of two perpendicular number lines: the x-axis (horizontal) and the y-axis (vertical). These axes intersect at the origin (0, 0), dividing the plane into four quadrants.
Key Terms: origin, x-axis, y-axis, quadrants, coordinates, coordinate plane (xy-plane)
Application: Used to plot points, graph equations, and analyze geometric relationships.
The Distance Formula
The distance formula calculates the distance between two points P$(x_1, y_1)$ and Q$(x_2, y_2)$ in the coordinate plane:
$ d(P, Q) = \sqrt{(x_2 - x_1)^2 + (y_2 - y_1)^2} $
Key Point: This formula is derived from the Pythagorean Theorem.
Example: Find the distance between $P(-8, 4)$ and $Q(3, -2)$.
The Midpoint Formula
The midpoint formula finds the point exactly halfway between two points $P(x_1, y_1)$ and $Q(x_2, y_2)$:
$ M = \left( \frac{x_1 + x_2}{2}, \frac{y_1 + y_2}{2} \right) $
Key Point: The midpoint is the average of the x-coordinates and the y-coordinates.
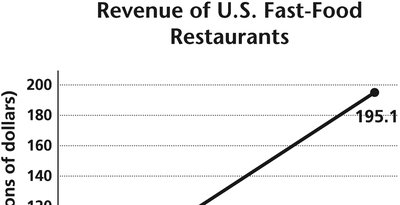
Example: Estimate the midpoint of fast-food revenue between 1990 and 2014 using the graph below.
Equations in Two Variables
An equation in two variables relates x and y. The graph of such an equation is the set of all points (x, y) that satisfy the equation.
Key Point: Solutions to the equation are represented as ordered pairs.
Example: For $y = 4x - 1$, some solutions are (0, -1), (1, 3), (2, 7).
Graphing an Equation by Point Plotting
To graph an equation:
Find the intercepts (where the graph crosses the axes).
Find additional ordered pairs as needed.
Plot the points.
Connect the points with a smooth line or curve.
Functions and Relations
Relations and Functions
A relation is a set of ordered pairs. A function is a relation in which each input (x-value) corresponds to exactly one output (y-value).
Key Point: In a function, no two ordered pairs have the same first component with different second components.
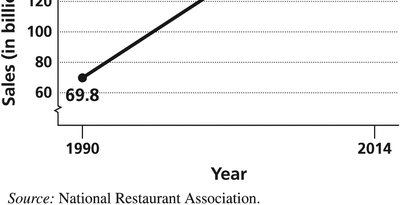
Example: The diagram below shows a relation that is not a function, since one input maps to multiple outputs.
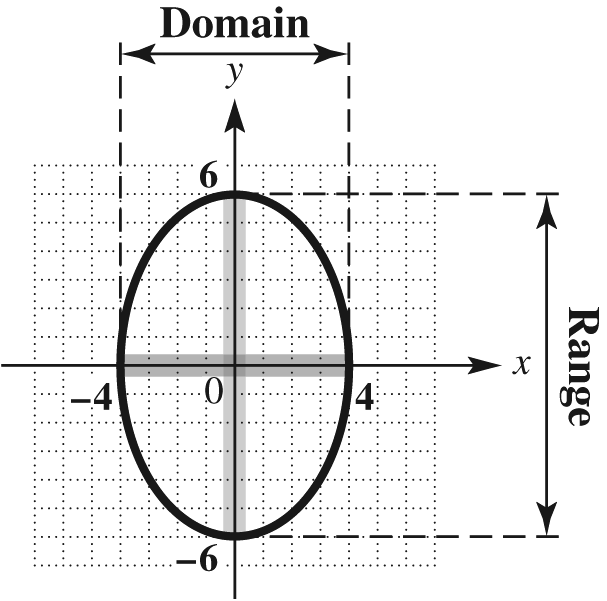
Domain and Range
The domain of a relation is the set of all possible input values (x-values). The range is the set of all possible output values (y-values).
Key Point: The domain and range can be found from a set of ordered pairs, a table, or a graph.
Example: The diagram below illustrates domain and range on a graph.
Determining Whether Relations Are Functions: The Vertical Line Test
The vertical line test states that a graph represents a function if and only if no vertical line intersects the graph at more than one point.
Key Point: If a vertical line crosses the graph more than once, the relation is not a function.
Function Notation
Function notation expresses the output of a function f for an input x as $f(x)$. For example, if $f(x) = 2x + 1$, then $f(3) = 7$.
Key Point: $f(x)$ is not multiplication; it denotes the value of the function at x.
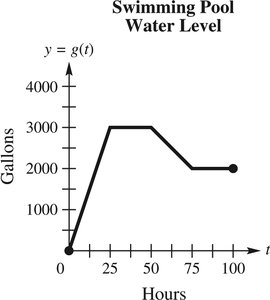
Increasing, Decreasing, and Constant Functions
A function is increasing on an interval if its output rises as x increases, decreasing if its output falls, and constant if its output remains the same.
Key Point: These properties are determined by comparing $f(x_1)$ and $f(x_2)$ for $x_1 < x_2$.
Example: The graph below shows intervals where a function is increasing, decreasing, or constant.
Linear Functions and Equations of Lines
Linear Functions
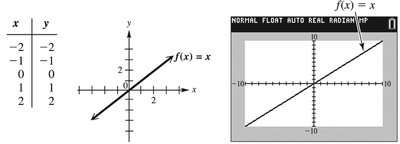
A linear function has the form $f(x) = ax + b$, where a and b are real numbers. Its graph is a straight line.
Key Point: The slope a determines the steepness and direction; b is the y-intercept.
Example: The graph below shows a linear function.
Standard Form of a Line
The standard form of a line is $Ax + By = C$, where A, B, and C are real numbers and A and B are not both zero.
Slope
The slope m of a line through points $(x_1, y_1)$ and $(x_2, y_2)$ is:
$ m = \frac{y_2 - y_1}{x_2 - x_1} $
Key Point: Slope measures the rate of change of y with respect to x.
Point-Slope and Slope-Intercept Forms
Point-Slope Form: $y - y_1 = m(x - x_1)$
Slope-Intercept Form: $y = mx + b$
Parallel and Perpendicular Lines
Parallel lines have the same slope.
Perpendicular lines have slopes that are negative reciprocals: $m_1 \cdot m_2 = -1$.
Graphs of Basic Functions
Basic Function Types and Their Graphs
Identity Function: $f(x) = x$
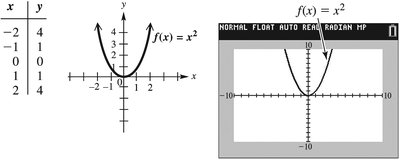
Squaring Function: $f(x) = x^2$
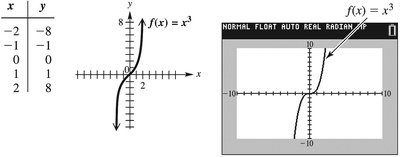
Cubing Function: $f(x) = x^3$
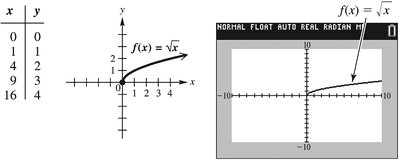
Square Root Function: $f(x) = \sqrt{x}$
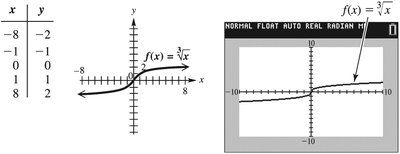
Cube Root Function: $f(x) = \sqrt[3]{x}$
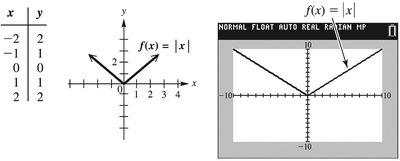
Absolute Value Function: $f(x) = |x|$
Piecewise-Defined and Greatest Integer Functions
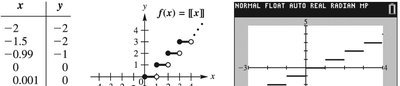
A piecewise-defined function is defined by different expressions over different intervals of its domain. The greatest integer function (step function) assigns to each x the greatest integer less than or equal to x.
Graphing Techniques
Transformations of Functions
Vertical and horizontal shifts: $f(x) + k$ shifts up/down; $f(x - h)$ shifts right/left.
Stretching/Shrinking: $af(x)$ stretches vertically if $a > 1$, shrinks if $0 < a < 1$.
Reflections: $-f(x)$ reflects across the x-axis; $f(-x)$ reflects across the y-axis.
Symmetry, Even and Odd Functions
Even function: $f(-x) = f(x)$ (symmetric about the y-axis)
Odd function: $f(-x) = -f(x)$ (symmetric about the origin)
Function Operations and Composition
Arithmetic Operations on Functions
Sum: $(f + g)(x) = f(x) + g(x)$
Difference: $(f - g)(x) = f(x) - g(x)$
Product: $(fg)(x) = f(x)g(x)$
Quotient: $(f/g)(x) = \frac{f(x)}{g(x)}$, $g(x) \neq 0$
Composition of Functions
The composition of functions $f$ and $g$ is $(f \circ g)(x) = f(g(x))$. The domain of $f \circ g$ consists of all x in the domain of g such that $g(x)$ is in the domain of f.
Quadratic Functions and Models
Quadratic Functions
A quadratic function has the form $f(x) = ax^2 + bx + c$, $a \neq 0$. Its graph is a parabola.
Vertex: The vertex is at $\left( -\frac{b}{2a}, f\left(-\frac{b}{2a}\right) \right)$.
Axis of symmetry: $x = -\frac{b}{2a}$
Opens upward if $a > 0$; downward if $a < 0$.
Completing the Square and Vertex Formula
Completing the square rewrites $ax^2 + bx + c$ in vertex form: $a(x - h)^2 + k$.
Quadratic Models
Quadratic functions are used to model projectile motion and other real-world phenomena where the relationship between variables is parabolic.
