 Back
BackGraphs of Basic Functions and Their Properties
Study Guide - Smart Notes
 Tailored notes based on your materials, expanded with key definitions, examples, and context.
Section 2.6: Graphs of Basic Functions
Continuity
Continuity is a fundamental concept in mathematics that describes whether a function can be drawn without lifting your pencil from the paper. A function is continuous over an interval if its graph has no breaks, holes, or jumps within that interval.
Continuous Function: A function is continuous on an interval if you can draw its graph over that interval without lifting your pencil.
Discontinuity: A point where the function is not continuous (e.g., a hole or jump in the graph).
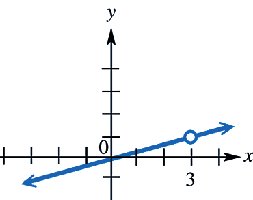
Example: Determining intervals of continuity for a function. If a function is continuous everywhere except at a point (e.g., x = 3), then it is continuous on the intervals to the left and right of that point.
Basic Functions and Their Graphs
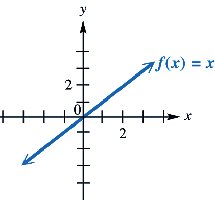
Identity Function
The identity function is defined as . It is a straight line passing through the origin with a slope of 1.
Domain:
Range:
Continuity: Continuous everywhere
Monotonicity: Increasing on its entire domain
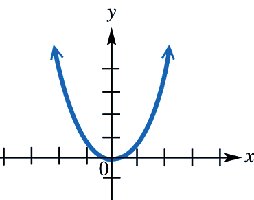
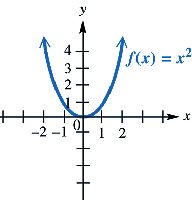
Squaring Function
The squaring function is defined as . Its graph is a parabola opening upwards.
Domain:
Range:
Continuity: Continuous everywhere
Monotonicity: Decreasing on , increasing on
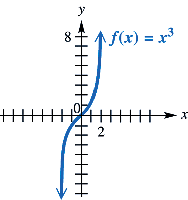
Cubing Function
The cubing function is defined as . Its graph is an S-shaped curve passing through the origin.
Domain:
Range:
Continuity: Continuous everywhere
Monotonicity: Increasing on its entire domain
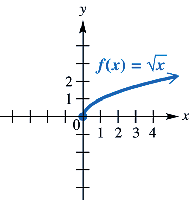
Square Root Function
The square root function is defined as . Its graph starts at the origin and increases slowly to the right.
Domain:
Range:
Continuity: Continuous on
Monotonicity: Increasing on its entire domain
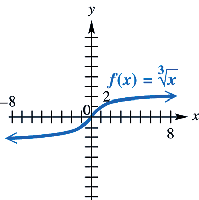
Cube Root Function
The cube root function is defined as . Its graph passes through the origin and is symmetric about the origin.
Domain:
Range:
Continuity: Continuous everywhere
Monotonicity: Increasing on its entire domain
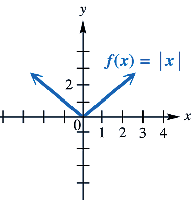
Absolute Value Function
The absolute value function is defined as . Its graph forms a "V" shape with the vertex at the origin.
Domain:
Range:
Continuity: Continuous everywhere
Monotonicity: Decreasing on , increasing on
Piecewise-Defined Functions
Definition and Graphing
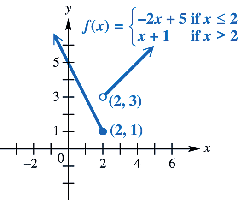
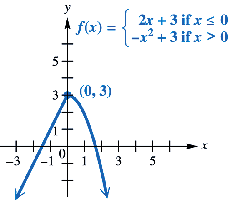
A piecewise-defined function is a function defined by different expressions for different intervals of the domain. To graph such a function, graph each piece on its respective interval.
Each "piece" of the function applies to a specific part of the domain.
Endpoints may be open or closed circles, depending on whether the interval is inclusive or exclusive.
Example: Graphing a piecewise-defined function:
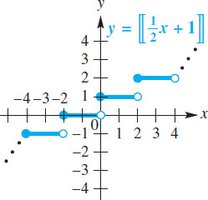
Greatest Integer Function (Step Function)
Definition
The greatest integer function, denoted , assigns to each real number the greatest integer less than or equal to . This function is also known as the "floor" function.
Domain:
Range: All integers ()
Continuity: Discontinuous at all integer values
Behavior: Constant on each interval for integer
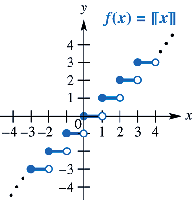
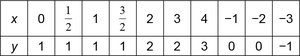
Example: Table of Values for a Greatest Integer Function
The following table shows sample values for :
x | 0 | 1/2 | 1 | 3/2 | 2 | 3 | 4 | -1 | -2 | -3 |
|---|---|---|---|---|---|---|---|---|---|---|
y | 1 | 1 | 1 | 1 | 2 | 2 | 3 | 0 | 0 | -1 |
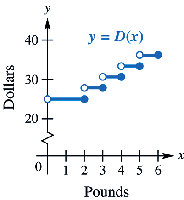
Application: Step Function in Real Life
Step functions are often used to model situations where quantities change in jumps rather than smoothly. For example, a shipping company charges a base rate for the first 2 pounds and an additional fee for each extra pound or fraction thereof. The cost function is a step function.
For in , cost is $25$ dollars.
For in , cost is $28$ dollars, and so on.
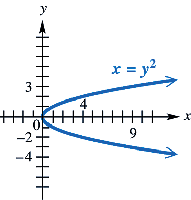
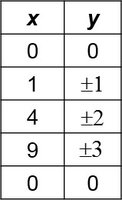
The Relation x = y2
Functions vs. Relations
A relation is any set of ordered pairs. A function is a special type of relation where each input (domain value) is paired with exactly one output (range value). The equation is a relation but not a function, because for some values of , there are two corresponding values of (one positive and one negative).
Domain:
Range:
x | 0 | 1 | 4 | 9 |
|---|---|---|---|---|
y | 0 | \pm 1 | \pm 2 | \pm 3 |
Note: The vertical line test can be used to determine if a relation is a function. If any vertical line crosses the graph more than once, the relation is not a function.
