 Back
BackTypes of Functions and Their Rate of Change
Study Guide - Smart Notes
 Tailored notes based on your materials, expanded with key definitions, examples, and context.
Linear Functions
Definition and General Form
A linear function is a function that can be written in the form , where m and b are constants. The graph of a linear function is always a straight line.
Example: or
Non-example: is not a function because it cannot be written as
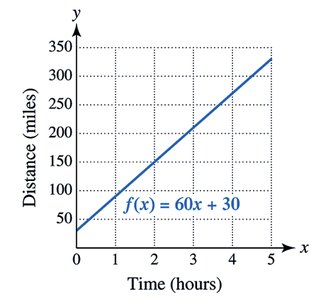
Application Example: A car initially located 30 miles north of the Texas border, traveling north at 60 miles per hour, is represented by .
Interpretation: means the car is 30 miles north at time zero.
The graph of this function is increasing, indicating a constant rate of travel.
Constant Rate of Change and Slope
In a linear function, the slope is constant. This means the value of always changes by an equal amount for each unit increase in .
Slope Formula: The slope of the line passing through points and is given by:
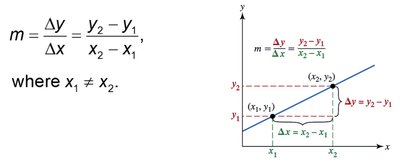
Interpretation: The slope indicates how much changes for each unit increase in .
Types of Slope
Positive Slope: Line rises as increases.
Negative Slope: Line falls as increases.
Zero Slope: Line is horizontal.
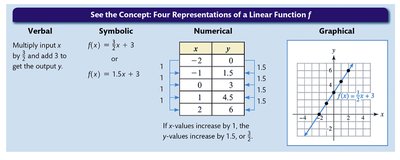
Four Representations of a Function
Functions can be represented in four main ways:
Verbal: Describes the relationship in words.
Symbolic: Uses an equation, e.g., .
Numerical: Table of values showing input-output pairs.
Graphical: Graph of the function on the coordinate plane.
Zeros and Intercepts of a Function
Zero of a Function: A value such that . This is the x-intercept of the graph.
Y-intercept: The value of , where the graph crosses the y-axis.
Example: For :
Y-intercept:
Zero:
Nonlinear Functions
Definition and Characteristics
A nonlinear function is any function that is not linear. These functions do not have a constant rate of change, and their graphs are not straight lines.
No constant rate of change
Graph is not a line
Can increase and decrease over different intervals
No single slope value
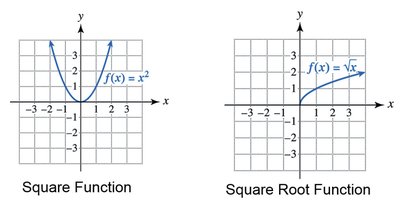
Examples:
Increasing and Decreasing Functions
Definitions
Let be defined on an interval :
Increasing on : If implies for all in .
Decreasing on : If implies for all in .
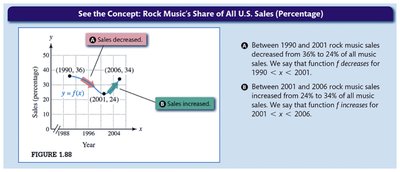
Example: Rock music sales decreased from 36% to 24% between 1990 and 2001 (decreasing function), then increased from 24% to 34% between 2001 and 2006 (increasing function).
Average Rate of Change
Definition and Calculation
For nonlinear functions, the average rate of change over an interval is calculated using the slope formula:
This measures how much the function changes on average per unit increase in over the interval.
Example: For , the average rate of change from to is:
Difference Quotient
Definition
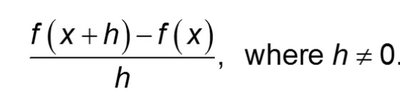
The difference quotient is a formula that expresses the average rate of change of a function over an interval of length :
, where
This is foundational for calculus and measures the average rate of change as approaches zero.
Example: For :
Difference quotient:
Applications and Group Work
Interpreting Slope and Intervals of Increase/Decrease
Example 1: Advertising spending increased from $95 billion in 2005. The slope is billion per year.
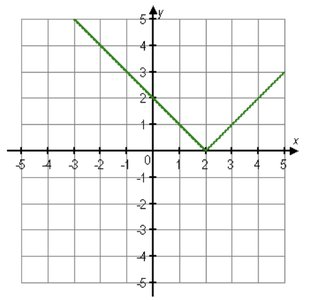
Example 2: For the function graphed below, identify intervals where the function is increasing or decreasing.
Example 3: For , . The slope is , meaning the tank loses 5 gallons per minute.
Example 4: If and , the average rate of change from 1 to 4 is .
Example 5: For , the difference quotient is .
