Ch. 1 - Equations and Inequalities
Blitzer - College Algebra 8th Edition
Blitzer8th EditionCollege AlgebraISBN: 9780136970514Not the one you use?Change textbook
Chapter 2, Problem 44a

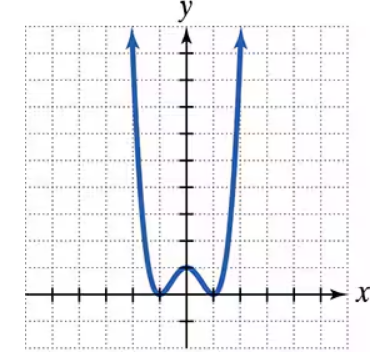
Use the graph to a. determine the x-intercepts, if any; b. determine the y-intercepts, if any. For each graph, tick marks along the axes represent one unit each.

Verified step by step guidance
1
Step 1: Observe the graph and identify the x-intercepts. The x-intercepts are the points where the curve crosses the x-axis. These points have a y-coordinate of 0.
Step 2: From the graph, locate the points where the curve intersects the x-axis. Based on the tick marks, the x-intercepts appear to be at x = -6, x = 0, and x = 6.
Step 3: Next, identify the y-intercept. The y-intercept is the point where the curve crosses the y-axis. This point has an x-coordinate of 0.
Step 4: From the graph, observe that the curve intersects the y-axis at the point (0, 0). This means the y-intercept is at y = 0.
Step 5: Summarize the findings: The x-intercepts are at x = -6, x = 0, and x = 6. The y-intercept is at y = 0.

Verified video answer for a similar problem:

This video solution was recommended by our tutors as helpful for the problem above.
Video duration:
1m
Was this helpful?

Key Concepts

Here are the essential concepts you must grasp in order to answer the question correctly.

X-Intercepts

X-intercepts are the points where a graph crosses the x-axis. At these points, the value of y is zero. To find the x-intercepts, one can set the function equal to zero and solve for x. In the context of the provided graph, identifying these points involves observing where the curve intersects the x-axis.
Recommended video:
Guided course
04:08
Graphing Intercepts

Y-Intercepts

Y-intercepts are the points where a graph crosses the y-axis, occurring when the value of x is zero. To determine the y-intercept, substitute x = 0 into the function and solve for y. In the graph shown, the y-intercept can be found by locating the point where the curve meets the y-axis.
Recommended video:
Guided course
04:08
Graphing Intercepts

Graph Interpretation

Graph interpretation involves analyzing the visual representation of a function to extract meaningful information, such as intercepts, trends, and behavior of the function. Understanding how to read a graph, including the significance of axes and tick marks, is crucial for accurately determining intercepts and other characteristics of the function depicted.
Recommended video:
Guided course
02:16
Graphs and Coordinates - Example