 Back
BackFinancial Accounting Fundamentals and Ratio Analysis
Study Guide - Smart Notes
 Tailored notes based on your materials, expanded with key definitions, examples, and context.
Financial Accounting: Core Concepts
Introduction to Financial Accounting
Financial accounting is the process of recording, summarizing, and analyzing the financial transactions of a business. Its primary purpose is to provide information to internal management and external stakeholders for decision-making.
Financial Accounting: Focuses on the preparation and analysis of financial statements for external users.
Managerial Accounting: Concerned with estimating and monitoring costs and benefits for internal decision-making.
Main Users: Managers, investors, creditors, and government agencies.
Key Questions: Is the company profitable? Is there a risk of bankruptcy? Is the company compliant with regulations?


Financial Statements
Basic Financial Statements
Financial statements are essential tools for understanding a firm's financial health. The two primary statements are the Balance Sheet and the Income Statement.
Balance Sheet: Provides a snapshot of a firm's financial position at a specific point in time.
Income Statement: Summarizes revenues and expenses over a period, showing profitability.
Core Elements: Revenues, expenses, assets, liabilities, and equity.

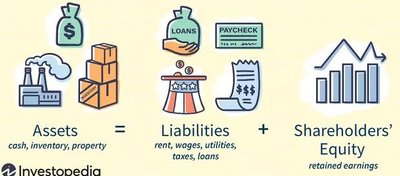
Balance Sheet Structure
The balance sheet lists assets, liabilities, and owners' equity. It is structured to show the relationship between what the company owns and owes.
Assets: Items of value owned by the organization (e.g., cash, inventory, property).
Liabilities: Debts owed to others (e.g., loans, wages, taxes).
Owners' Equity: The residual interest in assets after deducting liabilities.
Equation:
Balance Sheet Example
A typical balance sheet presents assets and liabilities for two periods, allowing comparison and analysis.
Assets | 2003 | 2004 | Liabilities & Owners' Equity | 2003 | 2004 |
|---|---|---|---|---|---|
Cash | 225 | 325 | Accounts Payable | 460 | 533 |
Accounts Receivable | 1,105 | 1,110 | Notes Payable | 392 | 245 |
Inventory | 895 | 1,375 | Total Current Liabilities | 852 | 778 |
Total Current Assets | 2,225 | 2,810 | Long Term Debt | 820 | 908 |
Plant & Equipment | 4,210 | 4,475 | Total Liabilities | 1,672 | 1,686 |
Less: Depreciation | -1,000 | -1,130 | Common Shares | 1,200 | 1,290 |
Intangible Assets | 80 | 40 | Retained Earnings | 2,643 | 3,219 |
Total Assets | 5,515 | 6,195 | Total Equity | 3,843 | 4,509 |
Balance Sheet Components
Assets and liabilities are classified as current or long-term, depending on their expected conversion or payment period.
Current Assets: Cash, accounts receivable, inventory (convertible within one year).
Fixed Assets: Plant, equipment, buildings, land (life greater than one year).
Current Liabilities: Accounts payable, taxes, wages, short-term loans (due within one year).
Long-term Liabilities: Bank loans, bonds (due after one year).
Owners' Equity: Common shares, retained earnings.
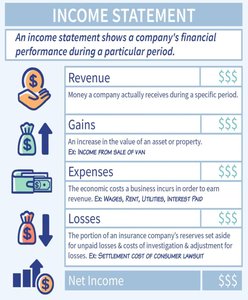
Income Statement
Structure and Components
The income statement summarizes a company's financial performance over a period. It includes revenues, expenses, and profits.
Revenue: Money received from sales of goods or services.
Expenses: Costs incurred to earn revenue (e.g., cost of goods sold, wages, rent, depreciation).
Profit Before Taxes: Revenue minus expenses.
Net Profit: Profit after taxes, available for reinvestment or dividends.


Estimated Values in Financial Statements
Cost Principle of Accounting
Financial statements often use estimated values based on the cost principle, which records assets at their original cost rather than market value.
Land: Listed at purchase price, not market value.
Plant & Equipment: Listed at purchase price minus accumulated depreciation.
Stock/Shares: Listed at par value.
Inventory & Accounts Receivable: Recorded at cost.
Financial Ratio Analysis
Purpose and Types of Ratios
Financial ratios are used to analyze a company's financial health and performance. Fundamental analysis relies on these ratios to assess intrinsic value and compare it to market value.
Working Capital Ratio: Measures liquidity.
Acid-Test (Quick) Ratio: Measures liquidity, excluding inventory.
Equity Ratio: Measures leverage and financial structure.
Inventory Turnover Ratio: Measures efficiency in selling inventory.
Return on Assets (ROA): Measures profitability relative to assets.
Return on Equity (ROE): Measures profitability relative to shareholders' equity.
Key Financial Ratios and Formulas
Working Capital:
Current Ratio:
Acid-Test Ratio:
Equity Ratio:
Inventory Turnover Ratio:
Return on Assets (ROA):
Return on Equity (ROE):
Other Ratios
Earnings per Share (EPS): Measures profit per share.
Price-Earnings Ratio (P/E): Compares share price to earnings per share.
Debt-to-Equity Ratio (D/E): Measures the degree of financial leverage.
Summary Table: Key Financial Ratios
Ratio | Formula | Purpose |
|---|---|---|
Working Capital | Current Assets - Current Liabilities | Liquidity |
Current Ratio | Current Assets / Current Liabilities | Liquidity |
Acid-Test Ratio | Quick Assets / Current Liabilities | Liquidity (conservative) |
Equity Ratio | Total Owners' Equity / Total Assets | Leverage |
Inventory Turnover | Sales / Inventories | Efficiency |
ROA | Net Income / Total Assets | Profitability |
ROE | Net Income / Total Equity | Profitability |
Additional info: Fundamental analysis is best performed using a combination of ratios for a comprehensive view of financial health. Technical analysis differs by focusing on market trends rather than intrinsic value.
