Back
BackFinancial Statements, Cash Flow, and Taxes: Chapter 2 Study Notes
Study Guide - Smart Notes
 Tailored notes based on your materials, expanded with key definitions, examples, and context.
Financial Statements and Reports
Overview of Financial Statements
Financial statements are essential tools for understanding a company's financial health and performance. The annual report typically includes four key financial statements:
Balance Sheet: Provides a snapshot of the firm's financial position at a specific point in time.
Income Statement: Shows the firm's performance over a period, detailing revenues and expenses.
Statement of Retained Earnings: Explains changes in retained earnings over the reporting period.
Statement of Cash Flows: Summarizes the changes in the firm's cash position, categorizing activities as operating, investing, or financing.
International Financial Reporting Standards (IFRS)
Canada adopted IFRS in 2011 for publicly traded companies, replacing Canadian GAAP. Private enterprises may use IFRS or ASPE. IFRS provides a global framework for financial reporting, ensuring comparability and transparency.
The Balance Sheet
Structure and Purpose
The balance sheet, also known as the statement of financial position, lists assets, liabilities, and equity. It shows the firm's resources and claims against those resources at a specific date.
Assets: Economic resources owned by the firm.
Liabilities: Obligations owed to creditors.
Equity: Owners' residual interest in the assets after liabilities are deducted.
Assets
Cash and Equivalents: Actual money available for spending.
Short-term Investments: Marketable securities with longer maturity than cash equivalents.
Accounts Receivable (A/R): Amounts owed by customers for sales made on credit.
Inventory: Investment in raw materials, work-in-process, and finished goods. Inventory valuation methods include FIFO and LIFO.
Net Plant and Equipment: Long-term assets reported net of accumulated depreciation.
Liabilities and Equity
Accounts Payable (A/P): Amounts owed to suppliers.
Notes Payable: Short-term loans due within a year.
Accruals: Taxes and wages owed but not yet paid.
Long-term Bonds: Debt securities issued to investors.
Preferred Stock: Hybrid security with characteristics of both debt and equity.
Common Stock: Proceeds from issuing shares.
Retained Earnings: Cumulative earnings not distributed as dividends.
Common Equity: Sum of common stock and retained earnings, representing net worth.
The Income Statement
Structure and Key Components
The income statement details a firm's revenues and expenses over a period, culminating in net income.
Net Sales: Revenues less discounts and returns.
Cost of Goods Sold (COGS): Direct costs of production, including labor and materials.
Depreciation and Amortization: Annual charges for the use of long-term assets.
Operating Expenses: Other expenses related to operations.
Earnings Before Interest and Taxes (EBIT): Operating income after deducting COGS and operating expenses.
Net Income (NI): Revenue less all expenses, taxes, and preferred dividends.
Earnings Per Share (EPS):
Example: Income Statement Data
2016 Net Sales: $3,000.0 million
2016 Net Income: $113.5 million
2016 EPS: $2.27
Statement of Changes in Equity
Purpose and Structure
This statement tracks changes in equity accounts, including net income, dividends, and stock issuance.
Opening Balance: Equity at the start of the period.
Additions: Net income increases retained earnings.
Deductions: Dividends reduce retained earnings.
Closing Balance: Equity at the end of the period.
Statement of Cash Flows
Categories of Cash Flows
The statement of cash flows separates activities into three categories:
Operating Activities: Cash flows from core business operations.
Investing Activities: Cash flows from acquisition and disposal of long-term assets.
Financing Activities: Cash flows from borrowing, repaying debt, and equity transactions.
Constructing the Statement
Start with net income.
Adjust for noncash items (e.g., depreciation).
Account for changes in balance sheet accounts.
Dividend payments and share buybacks reduce cash.
Example: Cash Flow Data (2016)
Net cash from operating activities: ($2.5) million
Net cash from investing activities: ($165.0) million
Net cash from financing activities: $162.5 million
Net change in cash: ($5.0) million
Free Cash Flow (FCF)
Definition and Importance
Free Cash Flow is the cash available for distribution to investors after all necessary investments to sustain operations. Financial managers focus on FCF rather than net income, as it represents the true cash-generating ability of the firm.
Operating Current Assets: Cash, inventory, receivables (excluding short-term investments).
Operating Current Liabilities: Accounts payable and accruals (excluding notes payable).
Uses of Free Cash Flow
Pay interest on debt
Repay principal on debt
Pay cash dividends
Buy back stock
Acquire nonoperating assets
Taxes
Overview and Impact
The value of a firm depends on after-tax cash flows. Taxes influence both corporate and investor decisions, affecting capital structure and investment choices.
Corporate Taxes: Rates vary by firm size, location, and income type. Both federal and provincial governments tax companies.
Personal Taxes: Progressive rates; capital gains taxed at half the rate of ordinary income.
Features of Corporate Taxes
Interest expenses are deductible; dividend payments are not.
Losses can be carried back 3 years and forward 20 years.
Dividend income from other Canadian corporations is fully excluded.
Features of Personal Taxes
Individuals face progressive tax rates (15% to 29%).
Capital gains are taxed at half the rate of ordinary income.
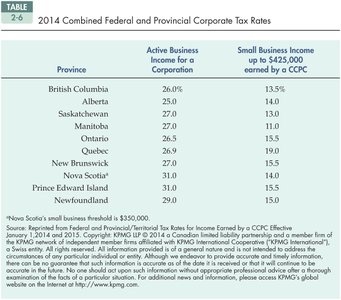
Example: 2014 Combined Federal and Provincial Corporate Tax Rates
The following table compares tax rates across provinces for active business income and small business income:
Province | Active Business Income for a Corporation | Small Business Income up to $425,000 earned by a CCPC |
|---|---|---|
British Columbia | 26.0% | 13.5% |
Alberta | 25.0% | 14.0% |
Saskatchewan | 27.0% | 15.0% |
Manitoba | 27.0% | 15.0% |
Ontario | 26.5% | 15.5% |
Quebec | 26.9% | 15.0% |
New Brunswick | 27.0% | 15.0% |
Nova Scotia* | 31.0% | 14.0% |
Prince Edward Island | 31.0% | 15.0% |
Newfoundland | 29.0% | 15.0% |
Additional info: Nova Scotia's small business threshold is $350,000.
Summary
Understanding financial statements is crucial for analyzing a firm's financial health.
Free cash flow is a key metric for financial managers and investors.
Tax considerations significantly impact corporate and personal financial decisions.