 Back
BackStep-by-Step Guidance for Economics Study Questions
Study Guide - Smart Notes
 Tailored notes based on your materials, expanded with key definitions, examples, and context.
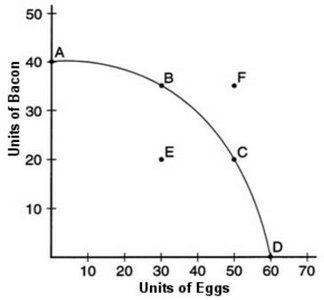
Q2.10: If the economy is operating at point C, which one of the following is the opportunity cost of producing an additional 15 units of bacon?
Background
Topic: Production Possibilities Frontier (PPF) and Opportunity Cost
This question tests your understanding of how opportunity cost is represented on a PPF, specifically when moving between points and increasing production of one good.
Key Terms and Formulas
Production Possibilities Frontier (PPF): A curve showing the maximum attainable combinations of two products that may be produced with available resources and technology.
Opportunity Cost: The value of the next best alternative foregone when a choice is made.
Step-by-Step Guidance
Identify the coordinates for point C on the PPF (units of eggs and units of bacon).
Find the point on the PPF where bacon production increases by 15 units from point C (look for the corresponding point along the curve).
Calculate the decrease in eggs as you move from point C to the new point with more bacon. This decrease represents the opportunity cost.
Compare the change in eggs to the change in bacon to determine the opportunity cost per 15 units of bacon.
Try solving on your own before revealing the answer!
Final Answer: 30 units of eggs
Moving from point C to a point with 15 more units of bacon requires sacrificing 30 units of eggs, which is the opportunity cost.
This is determined by observing the movement along the PPF and the corresponding changes in each good.
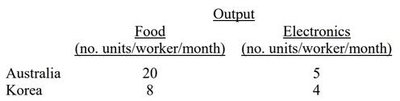
Q3.8: From the production data, which one of the following statements can be made about absolute advantage?
Background
Topic: Absolute Advantage in International Trade
This question tests your ability to interpret production data and identify which country has an absolute advantage in producing each good.
Key Terms and Formulas
Absolute Advantage: The ability of a country to produce more of a good with the same resources than another country.
Step-by-Step Guidance
Compare the output per worker per month for food between Australia and Korea.
Compare the output per worker per month for electronics between Australia and Korea.
Determine which country produces more of each good with the same resources.
Identify which country has an absolute advantage in food and which in electronics.
Try solving on your own before revealing the answer!
Final Answer: Australia has an absolute advantage in the production of both food and electronics.
Australia produces more units of both goods per worker per month than Korea, so it has an absolute advantage in both.
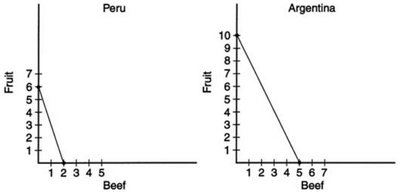
Q3.17: For which one of the following does Argentina have a comparative advantage in production?
Background
Topic: Comparative Advantage and Production Possibilities
This question tests your understanding of comparative advantage using PPFs for two countries and two goods.
Key Terms and Formulas
Comparative Advantage: The ability of a country to produce a good at a lower opportunity cost than another country.
Opportunity Cost: The amount of one good that must be given up to produce more of another good.
Step-by-Step Guidance
Calculate the opportunity cost of producing beef in Argentina and Peru using their PPFs.
Calculate the opportunity cost of producing fruit in Argentina and Peru.
Compare the opportunity costs for each good between the two countries.
Identify which country has the lower opportunity cost for each good, indicating comparative advantage.
Try solving on your own before revealing the answer!
Final Answer: Argentina has a comparative advantage in beef.
Argentina's opportunity cost for beef is lower than Peru's, so Argentina should specialize in beef production.
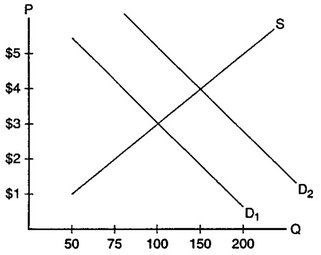
Q4.5: Referring to the graph above, which one of the following describes the initial equilibrium price and quantity?
Background
Topic: Market Equilibrium in Supply and Demand
This question tests your ability to read a supply and demand graph and identify the equilibrium point.
Key Terms and Formulas
Equilibrium Price: The price at which quantity demanded equals quantity supplied.
Equilibrium Quantity: The quantity at which supply and demand intersect.
Step-by-Step Guidance
Locate the intersection point of the supply and demand curves on the graph.
Read the price (P) and quantity (Q) values at the intersection.
Match these values to the answer choices provided.
Verify that the intersection represents the equilibrium point.
Try solving on your own before revealing the answer!
Final Answer: P = $3.00; Q = 100
The equilibrium occurs where the supply and demand curves cross at $3.00 and 100 units.
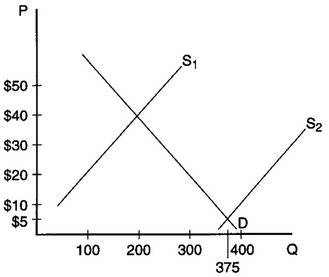
Q4.9: Referring to the graph above, which one of the following describes the initial equilibrium price and quantity?
Background
Topic: Market Equilibrium in Supply and Demand
This question tests your ability to interpret a supply and demand graph for hand-held calculators and find the equilibrium.
Key Terms and Formulas
Equilibrium Price: The price at which quantity demanded equals quantity supplied.
Equilibrium Quantity: The quantity at which supply and demand intersect.
Step-by-Step Guidance
Find the intersection of the supply curve (S1) and the demand curve (D) on the graph.
Read the price (P) and quantity (Q) at the intersection point.
Compare these values to the answer choices given.
Confirm that this intersection is the equilibrium point.
Try solving on your own before revealing the answer!
Final Answer: P = $5; Q = 375
The equilibrium is at $5 and 375 units, where the supply and demand curves meet.
