 Back
BackChapter 13: Chemical Kinetics – Study Notes
Study Guide - Smart Notes
 Tailored notes based on your materials, expanded with key definitions, examples, and context.
Introduction to Chemical Kinetics
What is Chemical Kinetics?
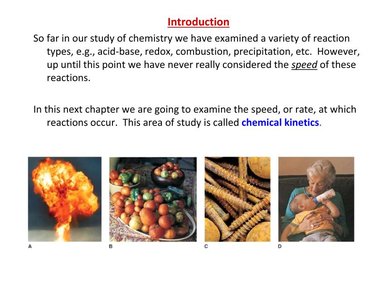
Chemical kinetics is the area of chemistry that studies the speed (or rate) at which chemical reactions occur. While previous studies may have focused on the types of reactions (acid-base, redox, precipitation, etc.), kinetics specifically examines how quickly reactants are converted to products under various conditions.
Reaction rate is a measure of how fast a chemical process occurs.
Understanding reaction rates is crucial for applications such as industrial synthesis, food preservation, and biological processes.
Reaction Rates
Definition and Measurement
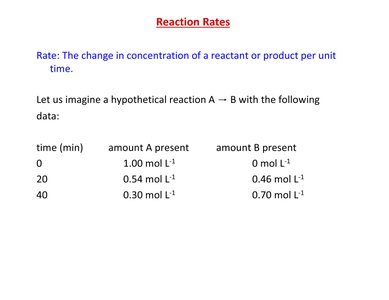
The rate of a reaction is defined as the change in concentration of a reactant or product per unit time. For a hypothetical reaction A → B, the rate can be measured by monitoring the concentration of A or B over time.
Rate formula:
Where is the change in concentration of B, and is the change in time.
Factors Affecting Reaction Rate
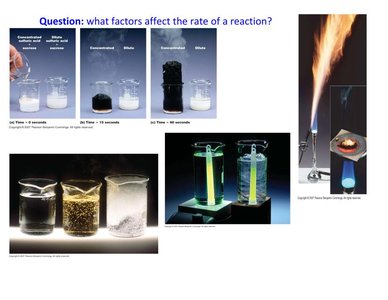
Several factors can influence how quickly a reaction proceeds:
Concentration of reactants
Temperature
Presence of a catalyst
Surface area of solid reactants
Nature of the reactants
Calculating Average Rate
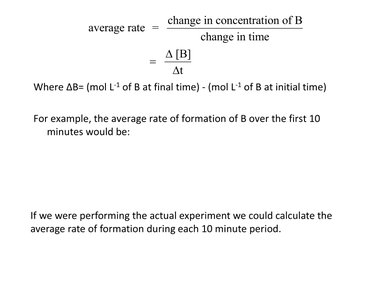
The average rate of formation of a product (or disappearance of a reactant) over a time interval is given by:
Where is the change in concentration of B over the time interval .
Graphical Representation of Reaction Rates
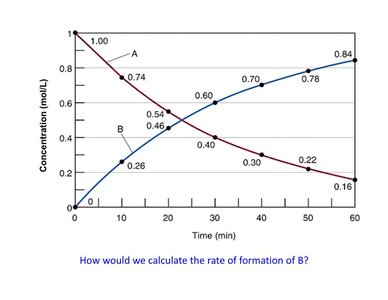
Concentration vs. time graphs can be used to visualize how reactant and product concentrations change during a reaction. The slope of the tangent to the curve at any point gives the instantaneous rate at that moment.
Rate of Formation vs. Rate of Disappearance
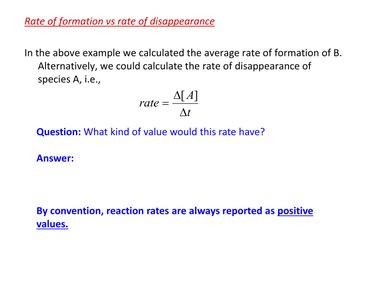
Rates can be expressed as the rate of formation of a product or the rate of disappearance of a reactant. By convention, reaction rates are always reported as positive values.
For reactant A:
For product B:
Tabular Data and Rate Trends
Tabulating concentration and rate data helps visualize how the rate changes over time as reactants are consumed and products are formed.
Time (min) | [A] (mol/L) | [B] (mol/L) | Rate (mol L-1 min-1) |
|---|---|---|---|
0 | 1.00 | 0 | 0.026 |
10 | 0.74 | 0.26 | 0.020 |
20 | 0.54 | 0.46 | 0.014 |
30 | 0.40 | 0.60 | 0.010 |
40 | 0.30 | 0.70 | 0.008 |
50 | 0.22 | 0.78 | 0.006 |
60 | 0.16 | 0.84 | 0.004 |
General Rate Expressions and Stoichiometry
General Rate Law for a Reaction
For a general reaction: , the rate can be expressed as:
Rates and Stoichiometry Example
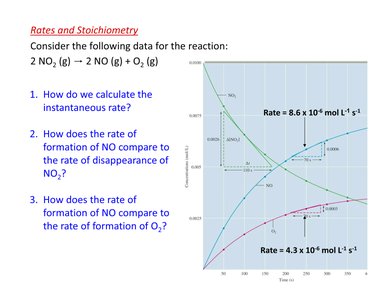
Consider the reaction:
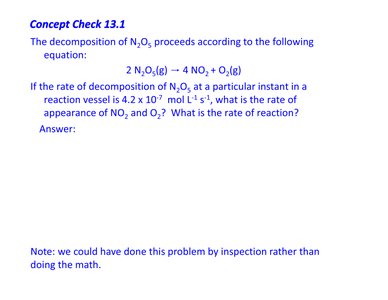
The rate of disappearance of NO2 is twice the rate of formation of O2.
Instantaneous rates can be determined from the slope of a tangent to the concentration vs. time curve.
Dependence of Rate on Concentration
Experimental Determination
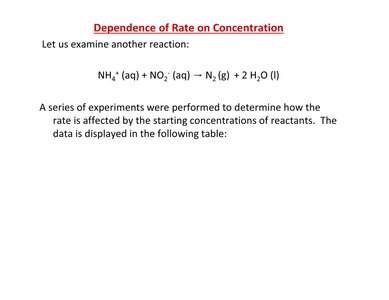
The effect of reactant concentration on reaction rate is determined experimentally. For example, the reaction:
By varying the initial concentrations of reactants and measuring the rate, the relationship between concentration and rate can be established.
Rate Laws and Reaction Orders
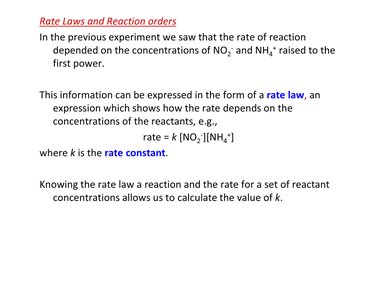
The rate law expresses the relationship between the rate of a reaction and the concentration of its reactants. For example:
Here, the reaction is first order in NO2-, first order in NH4+, and second order overall.
k is the rate constant.
Determining Reaction Order
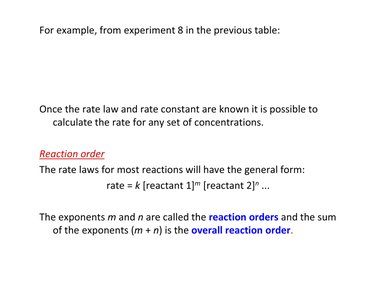
Reaction orders are determined by comparing how the rate changes as the concentration of each reactant is varied. The exponents in the rate law are called reaction orders, and their sum is the overall reaction order.
Reaction orders are not necessarily equal to the stoichiometric coefficients in the balanced equation.
Using Initial Rates to Determine Rate Laws
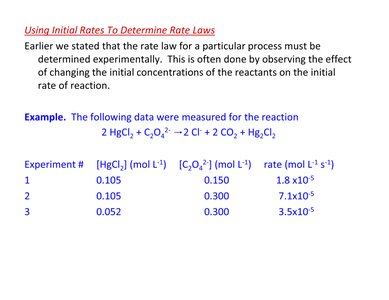
The initial rate method involves measuring the rate at the very beginning of the reaction for different initial concentrations. This allows for the determination of the rate law experimentally.
Effect of Reaction Order on Rate
The exponent in the rate law (reaction order) determines how the rate changes with concentration:
If order is 0: rate is independent of concentration.
If order is 1: rate doubles when concentration doubles.
If order is 2: rate quadruples when concentration doubles.
If order is negative: rate decreases as concentration increases.
Units of the Rate Constant, k
Dependence on Reaction Order
The units of the rate constant depend on the overall order of the reaction. The rate of reaction always has units of mol L-1 s-1, so the units of k must balance the units in the rate law equation.
For a zero-order reaction: k has units of mol L-1 s-1
For a first-order reaction: k has units of s-1
For a second-order reaction: k has units of L mol-1 s-1
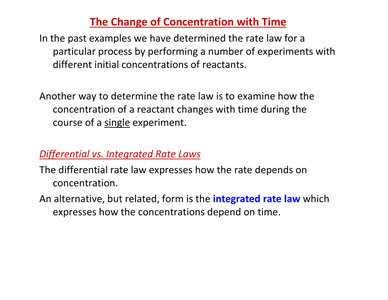
The Change of Concentration with Time
Differential vs. Integrated Rate Laws
The differential rate law expresses how the rate depends on concentration, while the integrated rate law expresses how concentration depends on time.
Integrated rate laws are useful for determining reaction order from concentration vs. time data.
Zero-Order, First-Order, and Second-Order Reactions
Zero-order: Rate is independent of concentration. [A] vs. time is a straight line.
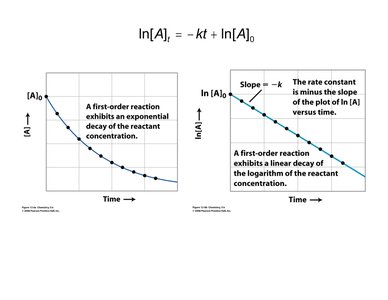
First-order: Rate is proportional to [A]. ln[A] vs. time is a straight line.
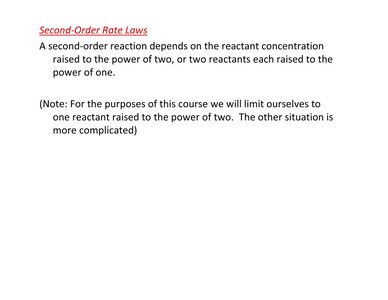
Second-order: Rate is proportional to [A]2 or [A][B]. 1/[A] vs. time is a straight line.
First-Order Integrated Rate Law
For a first-order reaction, the integrated rate law is:
A plot of ln[A] vs. time yields a straight line with slope -k.
Second-Order Rate Laws
For a second-order reaction (one reactant):
A plot of 1/[A] vs. time yields a straight line with slope k.
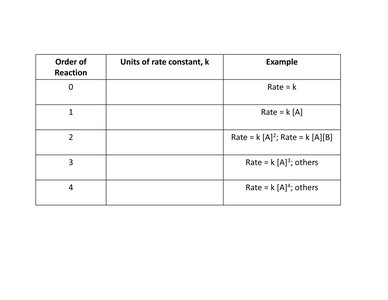
Summary Table: Units of Rate Constant by Reaction Order
Order of Reaction | Units of rate constant, k | Example |
|---|---|---|
0 | mol L-1 s-1 | Rate = k |
1 | s-1 | Rate = k[A] |
2 | L mol-1 s-1 | Rate = k[A]2; Rate = k[A][B] |
3 | L2 mol-2 s-1 | Rate = k[A]3; others |
4 | L3 mol-3 s-1 | Rate = k[A]4; others |
Key Concepts and Applications
Reaction rates are determined by measuring changes in concentration over time.
Rate laws must be determined experimentally and express the dependence of rate on reactant concentrations.
The units of the rate constant depend on the overall reaction order.
Integrated rate laws allow calculation of concentrations at any time during a reaction.
Understanding kinetics is essential for controlling chemical processes in industry, biology, and the environment.
