 Back
BackChemical Equilibrium: The Extent of Chemical Reactions
Study Guide - Smart Notes
 Tailored notes based on your materials, expanded with key definitions, examples, and context.
Equilibrium: The Extent of Chemical Reactions
Introduction to Chemical Equilibrium
Chemical equilibrium is a fundamental concept in general chemistry, describing the state in which the rates of the forward and reverse reactions are equal, resulting in no net change in the concentrations of reactants and products. This chapter explores the nature of equilibrium, the equilibrium constant, and how to analyze and predict the behavior of chemical systems at equilibrium.
The Equilibrium State and the Equilibrium Constant
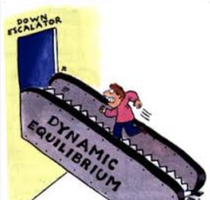
At equilibrium, chemical reactions are reversible and proceed in both directions at equal rates. The concentrations of reactants and products remain constant over time, although the reactions themselves continue to occur. This state is known as dynamic equilibrium, as illustrated by the analogy of a person running up a down escalator—movement continues, but there is no net change in position.
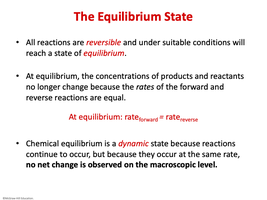
Reversible reactions can proceed in both the forward and reverse directions.
At equilibrium:
No net change is observed on the macroscopic level, even though molecular changes continue.
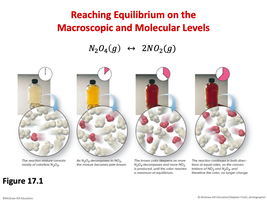
Reaching Equilibrium on the Macroscopic and Molecular Levels
Equilibrium can be observed both macroscopically (no visible change in color, pressure, etc.) and microscopically (molecules continue to react). For example, the reaction between dinitrogen tetroxide and nitrogen dioxide demonstrates how equilibrium is established as the concentrations of both species stabilize over time.
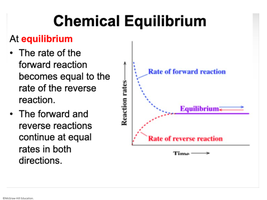
Chemical Equilibrium: Rates and Graphical Representation
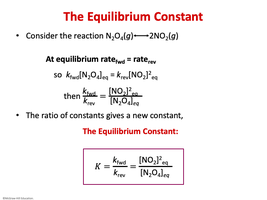
At equilibrium, the rate of the forward reaction equals the rate of the reverse reaction. This can be visualized graphically, where the rates of both reactions level off and become constant over time.
The Equilibrium Constant (K)
The equilibrium constant, K, quantifies the ratio of product concentrations to reactant concentrations at equilibrium for a given reaction. For the reaction :
At equilibrium:
The equilibrium constant is defined as: $
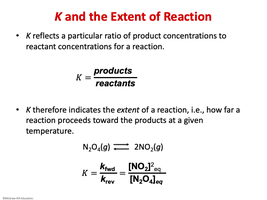
K and the Extent of Reaction
The value of K indicates how far a reaction proceeds toward products at a given temperature. It is calculated as the ratio of product concentrations to reactant concentrations at equilibrium:
$
A large K means the reaction favors products; a small K means it favors reactants.
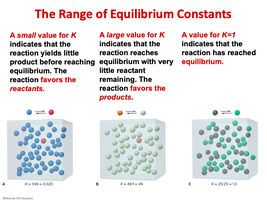
The Range of Equilibrium Constants
The magnitude of K provides insight into the position of equilibrium:
K < 1: Reaction favors reactants; little product is formed.
K > 1: Reaction favors products; most reactant is converted to product.
K = 1: Significant amounts of both reactants and products are present at equilibrium.
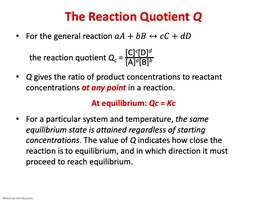
The Reaction Quotient (Q)
The reaction quotient, Q, is calculated using the same expression as K but with concentrations at any point in the reaction (not necessarily at equilibrium):
For a general reaction : $
At equilibrium, .
The value of Q indicates how close the system is to equilibrium and in which direction the reaction must proceed.
Comparing Q and K to Determine Reaction Direction
By comparing Q and K, we can predict the direction in which a reaction will proceed to reach equilibrium:
If Q < K: The reaction will proceed forward (toward products).
If Q > K: The reaction will proceed in reverse (toward reactants).
If Q = K: The system is at equilibrium.
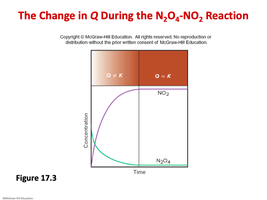
The Change in Q During a Reaction
As a reaction progresses, the value of Q changes until it equals K at equilibrium. This can be visualized by tracking the concentrations of reactants and products over time.
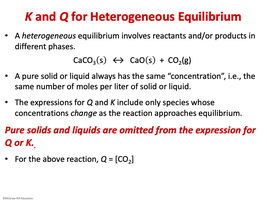
K and Q for Heterogeneous Equilibrium
In heterogeneous equilibrium, reactants and/or products are in different phases (solid, liquid, gas). The concentrations of pure solids and liquids are constant and are therefore omitted from the expressions for K and Q:
For example, in the reaction , only the gaseous component is included:
$
Pure solids and liquids do not appear in the equilibrium expression.
Summary Table: Key Concepts in Chemical Equilibrium
Concept | Definition | Key Equation |
|---|---|---|
Dynamic Equilibrium | State where forward and reverse reactions occur at equal rates | |
Equilibrium Constant (K) | Ratio of product to reactant concentrations at equilibrium | |
Reaction Quotient (Q) | Ratio of product to reactant concentrations at any point | |
Heterogeneous Equilibrium | Equilibrium involving more than one phase; omit pure solids/liquids | Only include gases and aqueous species in K or Q |
