 Back
BackGeneral Chemistry Exam 4 Practice Guidance: Chemical Kinetics & Equilibrium
Study Guide - Smart Notes
 Tailored notes based on your materials, expanded with key definitions, examples, and context.
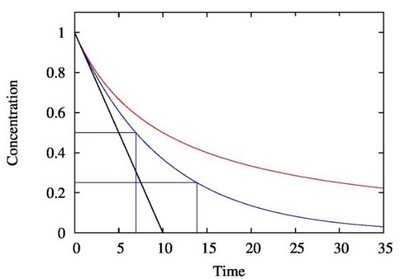
Q8. The figure on the right represents how the concentration of a reactant changes as a function of time, during zeroth, first and second order reactions. Which of the following correctly labels the figure?
Background
Topic: Chemical Kinetics – Reaction Order
This question tests your understanding of how the concentration of a reactant changes over time for reactions of different orders (zeroth, first, and second order). Recognizing these patterns is important for interpreting kinetic data and determining reaction mechanisms.
Key Terms and Formulas:
Zeroth-order reaction: Rate is independent of reactant concentration.
First-order reaction: Rate is proportional to reactant concentration.
Second-order reaction: Rate is proportional to the square of reactant concentration.
Step-by-Step Guidance
Examine the shapes of the curves in the figure. Each curve represents a different reaction order.
Recall that for a zeroth-order reaction, concentration decreases linearly with time.
For a first-order reaction, concentration decreases exponentially (curved, but not as steep as second-order).
For a second-order reaction, concentration decreases even more rapidly at first, then levels off more slowly.
Match the colors or lines in the figure to the expected behavior for each order.
Try solving on your own before revealing the answer!
Final Answer: B. Black = 0th order, blue = 1st order, red = 2nd order
The black line is linear (zeroth order), the blue line is exponential (first order), and the red line is curved more steeply (second order).
