 Back
BackHeating and Cooling Curves: Calculating Heat for Phase Changes
Study Guide - Smart Notes
 Tailored notes based on your materials, expanded with key definitions, examples, and context.
Heating and Cooling Curves
Introduction to Heating and Cooling Curves
Heating and cooling curves illustrate how the temperature of a substance changes as heat is added or removed, especially during phase transitions such as melting and boiling. These curves are essential for understanding the energy changes involved in converting a substance from one phase to another.
Calculating Total Heat for Phase Changes
To calculate the total amount of heat required to convert a given mass of a substance (e.g., ice at a subzero temperature) to another phase (e.g., steam above 100°C), it is necessary to consider each step of the process:
Heating the solid (ice) to its melting point
Melting the solid to liquid (fusion)
Heating the liquid to its boiling point
Vaporizing the liquid to gas
Heating the gas to the final temperature
Stepwise Calculation of Heat Required
Each step involves a different calculation:
Heating ice from -10.0°C to 0°C: Where is mass, is the specific heat capacity of ice, and is the temperature change.
Melting ice at 0°C to liquid water: Where is the enthalpy of fusion (energy required to melt ice).
Heating water from 0°C to 100°C:
Vaporizing water at 100°C to steam: Where is the enthalpy of vaporization (energy required to boil water).
Heating steam from 100°C to 110°C:
The total heat required is the sum of all steps:
Example Calculation
Calculate the total heat required to convert 100. g of ice at -10.0°C to steam at 110.°C, given:
Heat capacity of ice: 2.08 J/g·K
Heat capacity of water: 4.18 J/g·K
Heat capacity of steam: 1.84 J/g·K
Enthalpy of fusion (): typically 334 J/g
Enthalpy of vaporization (): typically 2260 J/g
Apply the equations above for each step, using the appropriate values for mass, specific heat, and enthalpy changes.
Heating and Cooling Curve Diagram
The diagram below shows a typical heating curve for water, illustrating the temperature plateaus during phase changes (melting and vaporization) and the regions where temperature increases with added heat.
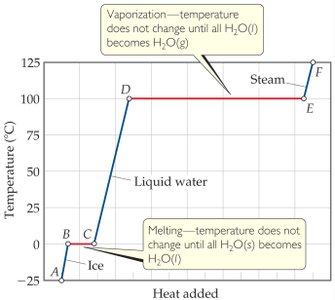
Key Points from the Diagram
Plateau at 0°C: Represents the melting of ice to liquid water. Temperature remains constant until all ice has melted.
Plateau at 100°C: Represents the boiling of water to steam. Temperature remains constant until all water has vaporized.
Sloped regions: Temperature increases as heat is added to a single phase (solid, liquid, or gas).
Summary Table: Steps in Heating Curve Calculations
Step | Process | Equation | Typical Value Needed |
|---|---|---|---|
1 | Heating ice | cice = 2.08 J/g·K | |
2 | Melting ice | = 334 J/g | |
3 | Heating water | cwater = 4.18 J/g·K | |
4 | Vaporizing water | = 2260 J/g | |
5 | Heating steam | csteam = 1.84 J/g·K |
Additional info: The values for enthalpy of fusion and vaporization are standard for water at 1 atm pressure. Always check your textbook or assignment for the exact values required.
