Textbook Question
The following plot shows two pH titration curves, each representing the titration of 50.0 mL of 0.100 M acid with 0.100 M NaOH:
. (b) What is the approximate pH at the equivalence point for each of the acids?
967
views


 Verified step by step guidance
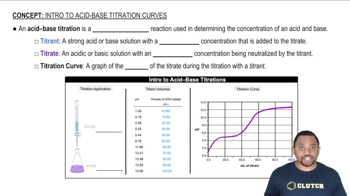
 03:04
03:04 01:07
01:07 01:09
01:09The following plot shows two pH titration curves, each representing the titration of 50.0 mL of 0.100 M acid with 0.100 M NaOH:
. (b) What is the approximate pH at the equivalence point for each of the acids?
The following pictures represent solutions at various stages in the titration of a weak base B with aqueous HCl. (Cl- ions and solvent water molecules have been omitted for clarity.)
. (b) Is the pH at the equivalence point more or less than 7?
The following pictures represent solutions that contain one or more of the compounds H2A, NaHA, and Na2A, where H2A is a weak diprotic acid. (Na+ ions and solvent water molecules have been omitted for clarity.)
(b) Which solution has the greatest buffer capacity?
The following pictures represent solutions that contain one or more of the compounds H2A, NaHA, and Na2A, where H2A is a weak diprotic acid. (Na+ ions and solvent water molecules have been omitted for clarity.)
(a) Which of the solutions are buffer solutions?
The following pictures represent solutions at various stages in the titration of sulfuric acid H2A (A2- = SO4 2-) with aqueous NaOH. (Na+ ions and water molecules have been omitted for clarity.)
. (b) Which solution has the highest pH? Draw a picture that represents the solution prior to addition of any NaOH.