New allopolyploid plant species can arise by hybridization between two species. If hybridization occurs between a diploid plant species with 2n = 14 and a second diploid species with 2n = 22, the new allopolyploid would have 36 chromosomes. What pattern of speciation is illustrated by the development of the allopolyploid species?
Table of contents
- 1. Introduction to Genetics51m
- 2. Mendel's Laws of Inheritance3h 37m
- 3. Extensions to Mendelian Inheritance2h 41m
- 4. Genetic Mapping and Linkage2h 28m
- 5. Genetics of Bacteria and Viruses1h 21m
- 6. Chromosomal Variation1h 48m
- 7. DNA and Chromosome Structure56m
- 8. DNA Replication1h 10m
- 9. Mitosis and Meiosis1h 34m
- 10. Transcription1h 0m
- 11. Translation58m
- 12. Gene Regulation in Prokaryotes1h 19m
- 13. Gene Regulation in Eukaryotes44m
- 14. Genetic Control of Development44m
- 15. Genomes and Genomics1h 50m
- 16. Transposable Elements47m
- 17. Mutation, Repair, and Recombination1h 6m
- 18. Molecular Genetic Tools19m
- 19. Cancer Genetics29m
- 20. Quantitative Genetics1h 26m
- 21. Population Genetics50m
- 22. Evolutionary Genetics29m
21. Population Genetics
Allelic Frequency Changes
Problem 40c
Textbook Question
Divide the contents of a large bag of different-colored candies randomly and approximately equally among the members of the group. Do not pick specific candy colors, but simply empty the contents of the bag onto a table and quickly divide the pile. If you are doing this exercise by yourself, divide the contents of the bag into five piles. Have each person compare the frequencies of each color in they pile with the frequencies in the original bag. Describe any differences in frequency between the pile and the original bag.

1
Step 1: Begin by emptying the contents of the bag of candies onto a table. Ensure that the candies are spread out randomly to avoid any bias in distribution.
Step 2: Divide the candies into five approximately equal piles (or among the group members if working collaboratively). Avoid selecting candies based on color; focus solely on dividing the total quantity evenly.
Step 3: Count the number of candies of each color in one of the smaller piles. Record these frequencies for each color in the pile.
Step 4: Count the number of candies of each color in the original bag before division. Record these frequencies as the baseline for comparison.
Step 5: Compare the frequencies of each color in the smaller pile to the frequencies in the original bag. Note any differences, such as overrepresentation or underrepresentation of certain colors, and consider how random sampling might lead to these variations.

This video solution was recommended by our tutors as helpful for the problem above
Video duration:
1mPlay a video:
Was this helpful?
Key Concepts
Here are the essential concepts you must grasp in order to answer the question correctly.
Genetic Variation
Genetic variation refers to the differences in DNA sequences among individuals within a population. This variation is crucial for evolution and natural selection, as it provides the raw material for adaptation. In the context of the candy exercise, the different colors represent genetic traits, and the distribution of these colors can illustrate how variation occurs in a population.
Recommended video:
Guided course
Genomic Variation
Sampling Error
Sampling error is the difference between the characteristics of a sample and the characteristics of the population from which it is drawn. In the candy division exercise, when dividing the candies into piles, random chance may lead to unequal representation of colors in each pile compared to the original bag. This concept highlights the importance of sample size and randomness in obtaining accurate representations of a population.
Recommended video:
Guided course
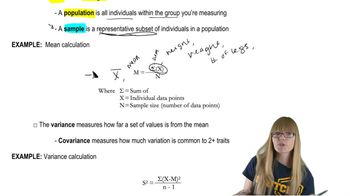
Mathematical Measurements
Frequency Distribution
Frequency distribution is a statistical representation that shows how often each value occurs in a dataset. In the candy exercise, comparing the frequency of each color in the piles to the original bag allows participants to analyze how the distribution of traits can change due to random sampling. Understanding frequency distributions is essential for interpreting genetic data and assessing population diversity.
Recommended video:
Guided course
Natural Selection
Related Videos
Related Practice
Textbook Question
394
views