Table of contents
- 1. Introduction to Genetics51m
- 2. Mendel's Laws of Inheritance3h 37m
- 3. Extensions to Mendelian Inheritance2h 41m
- 4. Genetic Mapping and Linkage2h 28m
- 5. Genetics of Bacteria and Viruses1h 21m
- 6. Chromosomal Variation1h 48m
- 7. DNA and Chromosome Structure56m
- 8. DNA Replication1h 10m
- 9. Mitosis and Meiosis1h 34m
- 10. Transcription1h 0m
- 11. Translation58m
- 12. Gene Regulation in Prokaryotes1h 19m
- 13. Gene Regulation in Eukaryotes44m
- 14. Genetic Control of Development44m
- 15. Genomes and Genomics1h 50m
- 16. Transposable Elements47m
- 17. Mutation, Repair, and Recombination1h 6m
- 18. Molecular Genetic Tools19m
- 19. Cancer Genetics29m
- 20. Quantitative Genetics1h 26m
- 21. Population Genetics50m
- 22. Evolutionary Genetics29m
20. Quantitative Genetics
Analyzing Trait Variance
Problem 31c
Textbook Question
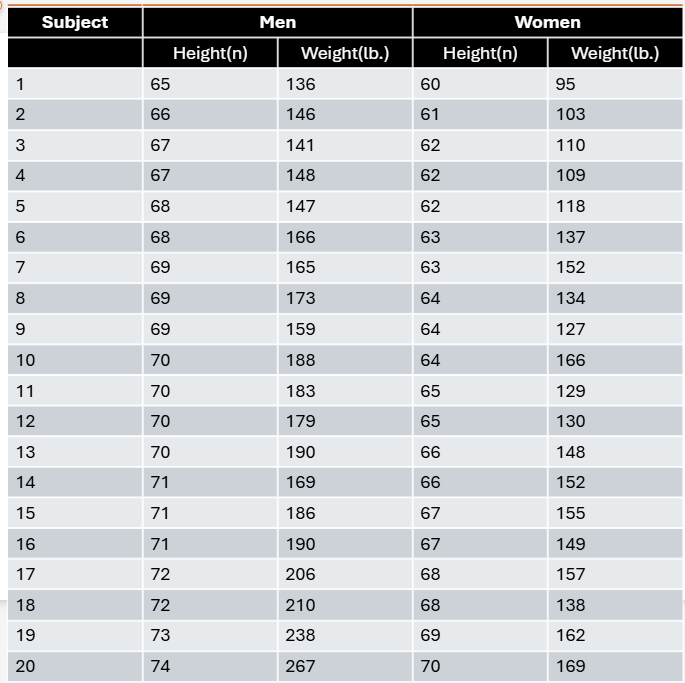
A total of 20 men and 20 women volunteer to participate in a statistics project. The height and weight of each subject are given in the table. Compare the numerical values with the visual distribution of heights and weights you drew in the histograms and describe whether you think your visual impression matches the numerical values.

 Verified step by step guidance
1
Step 1: Understand the data provided — you have height and weight measurements for 20 men and 20 women. The goal is to compare numerical summaries of these data with the visual impressions from histograms.
Step 2: Calculate key numerical summaries for each group (men and women) and each trait (height and weight). These summaries typically include measures of central tendency (mean, median) and measures of spread (range, variance, or standard deviation). For example, calculate the mean height for men and women separately using the formula: , where is each individual height and is the number of individuals.
Step 3: Examine the histograms you drew for height and weight distributions. Note the shape (e.g., symmetric, skewed), spread, and any apparent differences between men and women. For example, check if the histograms show men generally taller or heavier than women, or if there is overlap.
Step 4: Compare the numerical summaries with your visual observations. For instance, if the mean height for men is higher than for women, does the histogram reflect this difference? If the standard deviation is large, does the histogram show a wide spread?
Step 5: Conclude whether your visual impressions from the histograms align with the numerical data. Discuss any discrepancies or confirmations, such as whether the histograms accurately represent the central tendency and variability indicated by the numerical values.
 Verified video answer for a similar problem:
This video solution was recommended by our tutors as helpful for the problem above
Video duration:
1mPlay a video:
Was this helpful?
Key Concepts
Here are the essential concepts you must grasp in order to answer the question correctly.
Descriptive Statistics
Descriptive statistics summarize and describe the main features of a data set, including measures like mean, median, mode, range, and standard deviation. These numerical values help quantify the central tendency and variability of height and weight data, providing a basis for comparison with visual representations.
Recommended video:
Guided course

Descriptive Genetics
Histograms and Data Visualization
Histograms are graphical tools that display the frequency distribution of continuous data by grouping values into bins. They help visualize the shape, spread, and skewness of height and weight distributions, allowing for an intuitive understanding of data patterns and potential outliers.
Recommended video:
Guided course

Mathematical Measurements
Comparing Numerical and Visual Data
Comparing numerical summaries with visual plots involves assessing whether the statistical measures align with the observed distribution shapes. This comparison helps validate interpretations, identify discrepancies, and ensure that visual impressions accurately reflect the underlying data.
Recommended video:
Guided course

Humans, Mice, and Chimps

 8:34m
8:34mWatch next
Master Analyzing Trait Variance with a bite sized video explanation from Kylia
Start learningRelated Videos
Related Practice
Textbook Question
Suppose the mature height of a plant is a multifactorial trait under the control of five independently assorting genes, designated A, B, C, D, and E, and five environmental factors. There are two alleles of each gene (A₁, A₂, etc.). Each allele with a subscript 1 (i.e., A₁) contributes 5 cm to potential plant height, and each allele with a 2 subscript (i.e., A₂, etc.) contributes 10 cm to potential plant height. In other words, a genotype containing only 1 alleles (A₁A₁B₁B₁C₁C₁D₁D₁E₁E₁) would have a potential height of [(10)(5)]=50cm, and a genotype with only 2 alleles (A₂A₂B₂B₂C₂C₂D₂D₂E₂E₂) would have a potential height of [(10)(10)]=100cm.The five environmental factors are (1) amount of water, (2) amount of sunlight, (3) soil drainage, (4) nutrient content of soil, and (5) temperature. Each environmental factor can vary from optimal to poor. If all factors are optimal, assume that full potential height is attained. However, if one or more of the environmental factors is less than optimal, then height is reduced. The state of each environmental factor has an effect on growth. In this exercise, we'll assume that the growth is affected according to the following scale:Environmental Factor State Height LostOptimal (O) 0 cmGood (G) 4 cmFair (F) 8 cmMarginal (M) 12 cmPoor (P) 16 cmThus, for example, if one environmental factor is optimal, two are good, one is fair, and one is marginal, the loss of potential height is . If the loss of height potential is greater than the height potential of the plant, the plant does not survive.List two genotypes that have a height potential of 80 cm.
502
views
