The outcome of a single crossover between nonsister chromatids in the inversion loop of an inversion heterozygote varies depending on whether the inversion is of the paracentric or pericentric type. What differences are expected?
Table of contents
- 1. Introduction to Genetics51m
- 2. Mendel's Laws of Inheritance3h 37m
- 3. Extensions to Mendelian Inheritance2h 41m
- 4. Genetic Mapping and Linkage2h 28m
- 5. Genetics of Bacteria and Viruses1h 21m
- 6. Chromosomal Variation1h 48m
- 7. DNA and Chromosome Structure56m
- 8. DNA Replication1h 10m
- 9. Mitosis and Meiosis1h 34m
- 10. Transcription1h 0m
- 11. Translation58m
- 12. Gene Regulation in Prokaryotes1h 19m
- 13. Gene Regulation in Eukaryotes44m
- 14. Genetic Control of Development44m
- 15. Genomes and Genomics1h 50m
- 16. Transposable Elements47m
- 17. Mutation, Repair, and Recombination1h 6m
- 18. Molecular Genetic Tools19m
- 19. Cancer Genetics29m
- 20. Quantitative Genetics1h 26m
- 21. Population Genetics50m
- 22. Evolutionary Genetics29m
6. Chromosomal Variation
Chromosomal Rearrangements: Inversions
Problem 23
Textbook Question
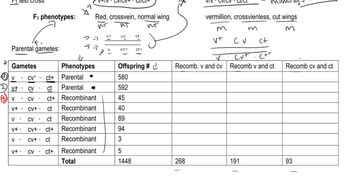
In the tomato, Solanum esculentum, tall (D−)(D−) is dominant to dwarf (dd) plant height, smooth fruit (P−) is dominant to peach fruit (pp), and round fruit shape (O−) is dominant to oblate fruit shape (oo). These three genes are linked on chromosome 1 of tomato in the order dwarf–peach–oblate. There are 12 map units between dwarf and peach and 17 map units between peach and oblate. A trihybrid plant (DPO/dpo) is test-crossed to a plant that is homozygous recessive at the three loci (dpo/dpo). The accompanying table shows the progeny plants. Identify the mechanism responsible for the resulting data that do not agree with the established genetic map.

 Verified step by step guidance
1
Step 1: Understand the genetic cross. The trihybrid plant (DPO/dpo) is test-crossed with a homozygous recessive plant (dpo/dpo). This means that the progeny phenotypes will directly reflect the gametes produced by the trihybrid parent. The genes are linked, so recombination frequencies will determine the distribution of progeny phenotypes.
Step 2: Analyze the genetic map. The genes are linked in the order dwarf–peach–oblate, with 12 map units between dwarf and peach, and 17 map units between peach and oblate. This means the recombination frequency between dwarf and peach is 12% (0.12), and between peach and oblate is 17% (0.17). The double crossover frequency is the product of these two values (0.12 × 0.17 = 0.0204 or 2.04%).
Step 3: Identify parental and recombinant phenotypes. The two most frequent phenotypes (Tall, smooth, round and Dwarf, peach, oblate) represent the parental types, as they occur most often. The less frequent phenotypes represent single and double crossover events. Use the progeny counts to categorize the phenotypes into parental, single crossover, and double crossover groups.
Step 4: Compare observed and expected frequencies. Based on the genetic map, calculate the expected frequencies of each phenotype (parental, single crossover, and double crossover) using the recombination frequencies. Compare these expected frequencies to the observed counts in the table to identify any discrepancies.
Step 5: Interpret the mechanism. If the observed data significantly deviate from the expected frequencies, this could indicate interference (a reduction in double crossover events compared to the expected frequency) or other factors affecting recombination. Use statistical tests, such as a chi-square test, to determine if the deviations are statistically significant and to identify the mechanism responsible for the discrepancy.
 Verified video answer for a similar problem:
This video solution was recommended by our tutors as helpful for the problem above
Video duration:
8mPlay a video:
Was this helpful?
Key Concepts
Here are the essential concepts you must grasp in order to answer the question correctly.
Genetic Linkage
Genetic linkage refers to the tendency of genes located close to each other on the same chromosome to be inherited together during meiosis. In this case, the genes for plant height, fruit texture, and fruit shape in tomatoes are linked, which affects the expected ratios of phenotypes in the progeny. Deviations from expected ratios can indicate the presence of linkage and the distances between genes.
Recommended video:
Guided course

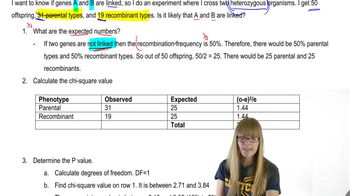
Chi Square and Linkage
Map Units and Recombination Frequency
Map units, or centimorgans, are a measure of genetic distance based on recombination frequency between linked genes. One map unit corresponds to a 1% chance of recombination occurring between two genes during gamete formation. The distances provided in the question (12 map units between dwarf and peach, and 17 between peach and oblate) suggest that recombination events can lead to unexpected phenotypic ratios in the progeny.
Recommended video:
Guided course

Mapping Genes
Test Cross
A test cross involves breeding an individual with a dominant phenotype (but unknown genotype) with a homozygous recessive individual. This allows researchers to determine the genotype of the dominant individual based on the phenotypes of the offspring. In this scenario, the trihybrid plant (DPO/dpo) is test-crossed to a homozygous recessive plant (dpo/dpo), which helps reveal the inheritance patterns and any discrepancies from expected ratios due to genetic linkage.
Recommended video:
Guided course

Trihybrid Cross
Related Videos
Related Practice
Textbook Question
446
views


