In a cross between a strain of large guinea pigs and a strain of small guinea pigs, the F₁ are phenotypically uniform, with an average size about intermediate between that of the two parental strains. Among 1014 F₂ individuals, 3 are about the same size as the small parental strain and 5 are about the same size as the large parental strain. How many gene pairs are involved in the inheritance of size in these strains of guinea pigs?
Table of contents
- 1. Introduction to Genetics51m
- 2. Mendel's Laws of Inheritance3h 37m
- 3. Extensions to Mendelian Inheritance2h 41m
- 4. Genetic Mapping and Linkage2h 28m
- 5. Genetics of Bacteria and Viruses1h 21m
- 6. Chromosomal Variation1h 48m
- 7. DNA and Chromosome Structure56m
- 8. DNA Replication1h 10m
- 9. Mitosis and Meiosis1h 34m
- 10. Transcription1h 0m
- 11. Translation58m
- 12. Gene Regulation in Prokaryotes1h 19m
- 13. Gene Regulation in Eukaryotes44m
- 14. Genetic Control of Development44m
- 15. Genomes and Genomics1h 50m
- 16. Transposable Elements47m
- 17. Mutation, Repair, and Recombination1h 6m
- 18. Molecular Genetic Tools19m
- 19. Cancer Genetics29m
- 20. Quantitative Genetics1h 26m
- 21. Population Genetics50m
- 22. Evolutionary Genetics29m
20. Quantitative Genetics
Heritability
Problem 24a
Textbook Question
Cattle breeders would like to improve the protein content and butterfat content of milk produced by a herd of cows. Narrow sense heritability values are 0.60 for protein content and 0.80 for butterfat content. The average percentages of these traits in the herd and the percentages of the traits in cows selected for breeding are as follows. Trait Herd Average Selected Cows Protein content 20.2% 22.7% Butterfat content 6.5% 7.4% Determine the selection differential (S) for each trait in this herd.
 Verified step by step guidance
1
Step 1: Understand the concept of selection differential (S). Selection differential is the difference between the average value of a trait in the selected individuals (breeding cows) and the average value of the trait in the population (herd average). It is calculated using the formula: S = X_selected - X_population, where X_selected is the trait value in selected individuals and X_population is the trait value in the population.
Step 2: Identify the given values for protein content. The herd average (X_population) for protein content is 20.2%, and the average for selected cows (X_selected) is 22.7%.
Step 3: Apply the formula for selection differential to protein content. Substitute the values into the formula: S_protein = X_selected_protein - X_population_protein. Use MathML to represent this: .
Step 4: Identify the given values for butterfat content. The herd average (X_population) for butterfat content is 6.5%, and the average for selected cows (X_selected) is 7.4%.
Step 5: Apply the formula for selection differential to butterfat content. Substitute the values into the formula: S_butterfat = X_selected_butterfat - X_population_butterfat. Use MathML to represent this: .
 Verified video answer for a similar problem:
This video solution was recommended by our tutors as helpful for the problem above
Video duration:
2mPlay a video:
Was this helpful?
Key Concepts
Here are the essential concepts you must grasp in order to answer the question correctly.
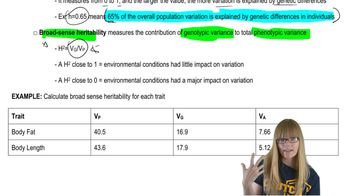
Narrow Sense Heritability (h²)
Narrow sense heritability (h²) is a measure of the proportion of phenotypic variance in a trait that can be attributed to additive genetic variance. It is crucial for predicting the response to selection in breeding programs, as it indicates how much of the trait's variation is heritable. Higher h² values suggest that selection will be more effective in improving the trait in future generations.
Recommended video:
Guided course

Calculating Heritability
Selection Differential (S)
The selection differential (S) is the difference between the mean phenotype of the selected individuals and the mean phenotype of the entire population. It quantifies the extent to which selected individuals differ from the average, providing insight into the potential for genetic improvement. A larger selection differential indicates a stronger selection pressure, which can lead to greater changes in the trait over generations.
Recommended video:
Guided course

Artificial Selection
Response to Selection (R)
Response to selection (R) refers to the expected change in the mean phenotype of a trait in the next generation as a result of selection. It can be calculated using the formula R = h² × S, where h² is the narrow sense heritability and S is the selection differential. Understanding R helps breeders anticipate the effectiveness of their selection strategies in achieving desired improvements in traits such as milk protein and butterfat content.
Recommended video:
Guided course

Artificial Selection

 7:04m
7:04mWatch next
Master Calculating Heritability with a bite sized video explanation from Kylia
Start learningRelated Videos
Related Practice
Textbook Question
509
views
