The seeds in bush bean pods are each the product of an independent fertilization event. Green seed color is dominant to white seed color in bush beans. If a heterozygous plant with green seeds self-fertilizes, what is the probability that 6 seeds in a single pod of the progeny plant will consist of 3 green and 3 white seeds?
Table of contents
- 1. Introduction to Genetics51m
- 2. Mendel's Laws of Inheritance3h 37m
- 3. Extensions to Mendelian Inheritance2h 41m
- 4. Genetic Mapping and Linkage2h 28m
- 5. Genetics of Bacteria and Viruses1h 21m
- 6. Chromosomal Variation1h 48m
- 7. DNA and Chromosome Structure56m
- 8. DNA Replication1h 10m
- 9. Mitosis and Meiosis1h 34m
- 10. Transcription1h 0m
- 11. Translation58m
- 12. Gene Regulation in Prokaryotes1h 19m
- 13. Gene Regulation in Eukaryotes44m
- 14. Genetic Control of Development44m
- 15. Genomes and Genomics1h 50m
- 16. Transposable Elements47m
- 17. Mutation, Repair, and Recombination1h 6m
- 18. Molecular Genetic Tools19m
- 19. Cancer Genetics29m
- 20. Quantitative Genetics1h 26m
- 21. Population Genetics50m
- 22. Evolutionary Genetics29m
2. Mendel's Laws of Inheritance
Monohybrid Cross
Problem 28c
Textbook Question
A variety of pea plant called Blue Persian produces a tall plant with blue seeds. A second variety of pea plant called Spanish Dwarf produces a short plant with white seed. The two varieties are crossed, and the resulting seeds are collected. All of the seeds are white; and when planted, they produce all tall plants. These tall F₁ plants are allowed to self-fertilize. The results for seed color and plant stature in the F₂ generation are as follows:
F₂ Plant Phenotype Number
Blue seed, tall plant. 97
White seed, tall plant 270
Blue seed, short plant 33
White seed, short plant 100
TOTAL 500
State the hypothesis being tested in this experiment.
 Verified step by step guidance
1
Identify the traits being studied: In this problem, the traits are plant stature (tall or short) and seed color (blue or white). These traits are being analyzed to determine their inheritance patterns.
Formulate the hypothesis: The hypothesis being tested is whether the traits for plant stature and seed color follow Mendelian inheritance patterns, specifically whether they assort independently according to Mendel's second law (the law of independent assortment).
Determine the expected phenotypic ratio: If the traits assort independently, the expected phenotypic ratio in the F₂ generation for two traits (each with two alleles) is 9:3:3:1. This corresponds to 9/16 tall plants with white seeds, 3/16 tall plants with blue seeds, 3/16 short plants with white seeds, and 1/16 short plants with blue seeds.
Compare the observed data to the expected ratio: The observed data for the F₂ generation is provided in the problem. To test the hypothesis, the observed data will need to be compared to the expected data based on the 9:3:3:1 ratio using a statistical test, such as the chi-square test.
State the null hypothesis: The null hypothesis is that there is no significant difference between the observed phenotypic ratios and the expected ratios based on Mendelian inheritance. If the chi-square test supports the null hypothesis, it suggests that the traits assort independently.
 Verified video answer for a similar problem:
This video solution was recommended by our tutors as helpful for the problem above
Video duration:
2mPlay a video:
Was this helpful?
Key Concepts
Here are the essential concepts you must grasp in order to answer the question correctly.
Mendelian Genetics
Mendelian genetics is the study of how traits are inherited through generations, based on the principles established by Gregor Mendel. It involves understanding dominant and recessive alleles, where dominant traits mask the expression of recessive ones. In this experiment, the inheritance patterns of seed color and plant stature are analyzed, showcasing Mendel's laws of segregation and independent assortment.
Recommended video:
Guided course

Descriptive Genetics
Phenotype and Genotype
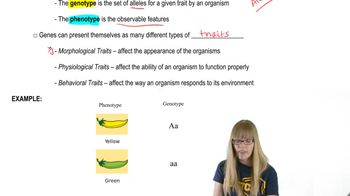
Phenotype refers to the observable characteristics of an organism, such as plant height and seed color, while genotype refers to the genetic makeup that determines these traits. In the given experiment, the phenotypes of the F₂ generation reveal the underlying genotypes, which can be inferred from the ratios of the observed traits. Understanding the relationship between genotype and phenotype is crucial for interpreting the results.
Recommended video:
Guided course

Gamete Genotypes
Punnett Square
A Punnett square is a diagram used to predict the genetic outcomes of a cross between two organisms. It helps visualize the possible combinations of alleles from the parents, allowing for the calculation of expected phenotypic ratios in the offspring. In this experiment, constructing a Punnett square based on the parental genotypes would help clarify the hypothesis regarding the inheritance of seed color and plant stature.
Recommended video:
Guided course

Chi Square Analysis
Related Videos
Related Practice
Textbook Question
438
views


