The following figure shows the results of Mendel's test-cross analysis of independent assortment. In this experiment, he first crossed pure-breeding round, yellow plants to pure-breeding wrinkled, green plants. The round yellow are crossed to pure-breeding wrinkled, green plants. Use chi-square analysis to show that Mendel's results do not differ significantly from those expected.
Table of contents
- 1. Introduction to Genetics51m
- 2. Mendel's Laws of Inheritance3h 37m
- 3. Extensions to Mendelian Inheritance2h 41m
- 4. Genetic Mapping and Linkage2h 28m
- 5. Genetics of Bacteria and Viruses1h 21m
- 6. Chromosomal Variation1h 48m
- 7. DNA and Chromosome Structure56m
- 8. DNA Replication1h 10m
- 9. Mitosis and Meiosis1h 34m
- 10. Transcription1h 0m
- 11. Translation58m
- 12. Gene Regulation in Prokaryotes1h 19m
- 13. Gene Regulation in Eukaryotes44m
- 14. Genetic Control of Development44m
- 15. Genomes and Genomics1h 50m
- 16. Transposable Elements47m
- 17. Mutation, Repair, and Recombination1h 6m
- 18. Molecular Genetic Tools19m
- 19. Cancer Genetics29m
- 20. Quantitative Genetics1h 26m
- 21. Population Genetics50m
- 22. Evolutionary Genetics29m
2. Mendel's Laws of Inheritance
Mendel's Experiments and Laws
Problem 23b
Textbook Question
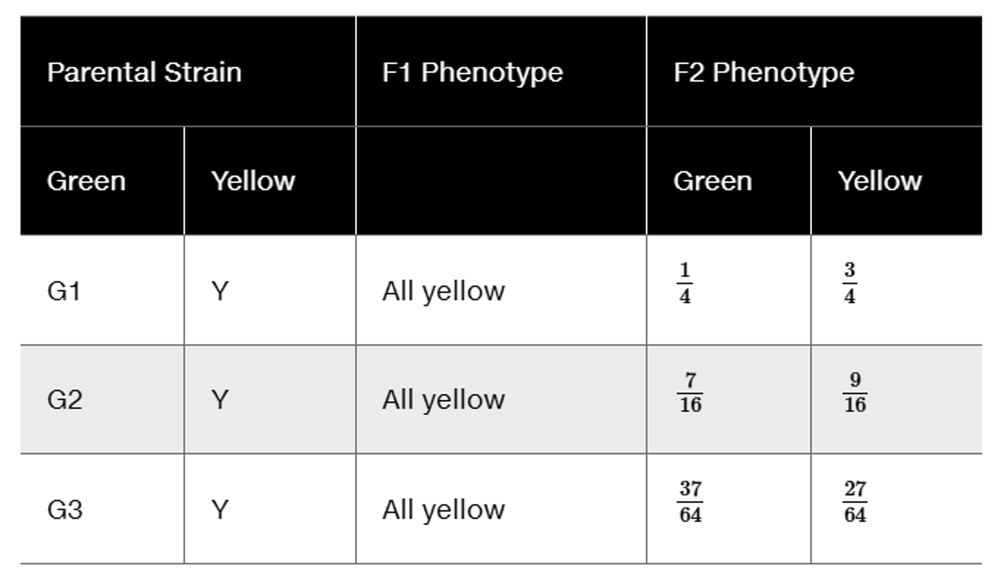
Three strains of green-seeded lentil plants appear to have the same phenotype. The strains are designated G₁, G₂, and G₃. Each green-seeded strain is crossed to a pure-breeding yellow-seeded strain designated Y. The F₁ of each cross are yellow; however, self-fertilization of F₁ plants produces F₂ with different proportions of yellow- and green-seeded plants as shown below.

Using the allele symbols A and a, B and b, and D and d to represent alleles at segregating genes, give the genotypes of parental and F₁ plants in each cross.
 Verified step by step guidance
1
Step 1: Understand the phenotypes and crosses. The green-seeded strains G₁, G₂, and G₃ are each crossed with a pure-breeding yellow-seeded strain Y. The F₁ generation in all crosses is all yellow, indicating that yellow is dominant over green.
Step 2: Analyze the F₂ phenotypic ratios to infer the number of genes involved. For G₁, the F₂ ratio is 3:1 (yellow:green), which suggests a single gene with simple dominance (A and a). For G₂, the F₂ ratio is 9:7 (yellow:green), which suggests two genes with complementary gene interaction (A and B). For G₃, the F₂ ratio is 27:37 (yellow:green), which suggests three genes interacting (A, B, and D).
Step 3: Assign genotypes to the parental strains. Since Y is pure-breeding yellow, it must be homozygous dominant for all relevant genes (e.g., AA, BB, DD). The green parental strains must be homozygous recessive for the genes involved in green seed color (e.g., aa, bb, dd).
Step 4: Determine the F₁ genotypes. Since all F₁ plants are yellow, they must be heterozygous for the genes involved (e.g., Aa, Bb, Dd), inheriting dominant alleles from the yellow parent and recessive alleles from the green parent.
Step 5: Summarize genotypes for each cross: For G₁, green parent is aa, yellow parent is AA, F₁ is Aa. For G₂, green parent is aabb, yellow parent is AABB, F₁ is AaBb. For G₃, green parent is aabbdd, yellow parent is AABBDD, F₁ is AaBbDd.
 Verified video answer for a similar problem:
This video solution was recommended by our tutors as helpful for the problem above
Video duration:
2mPlay a video:
Was this helpful?
Key Concepts
Here are the essential concepts you must grasp in order to answer the question correctly.
Mendelian Inheritance and Dominance
Mendelian inheritance explains how traits are passed from parents to offspring through dominant and recessive alleles. In this question, yellow seed color is dominant over green, as all F1 offspring are yellow. Understanding dominance helps predict phenotypic ratios in F2 generations.
Recommended video:
Guided course

Variations on Dominance
Monohybrid and Dihybrid Cross Ratios
Different F2 phenotypic ratios indicate the number of genes involved. A 3:1 ratio suggests a single gene (monohybrid), 9:7 or 7:9 ratios suggest two genes with epistasis or complementary gene action, and more complex ratios like 37:27 imply multiple genes. These ratios help deduce genotypes of parental strains.
Recommended video:
Guided course

Monohybrid Cross
Genotype-Phenotype Relationship and Allele Symbols
Allele symbols (A/a, B/b, D/d) represent different genes controlling seed color. Assigning genotypes to parental and F1 plants based on phenotypic ratios allows understanding of gene interactions and segregation patterns. This is essential for predicting offspring genotypes and phenotypes.
Recommended video:
Guided course

Non-Random Mating
Related Videos
Related Practice
Textbook Question
649
views


