 Back
BackCH5.1: Chromosome Mapping in Eukaryotes: Linkage, Crossing Over, and Genetic Mapping
Study Guide - Smart Notes
 Tailored notes based on your materials, expanded with key definitions, examples, and context.
Chromosome Mapping in Eukaryotes
Introduction to Linkage and Chromosome Mapping
Chromosome mapping is a fundamental technique in genetics that allows researchers to determine the relative positions of genes on a chromosome. Because there are more genes than chromosomes, some genes are inherited together, a phenomenon known as linkage. Linked genes do not assort independently, and their inheritance patterns can be used to estimate their physical proximity on a chromosome.
Linkage and Complete Linkage
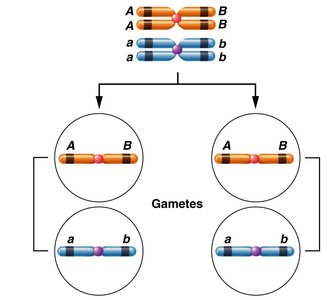
Genes located on the same chromosome are said to be linked. In complete linkage, only parental (noncrossover) gametes are produced, meaning the genes are inherited together without recombination. This occurs when genes are so close together that crossing over does not occur between them.
Parental gametes: Gametes that retain the original combination of alleles from the parent.
Recombinant gametes: Gametes that have new combinations of alleles due to crossing over.
Interlocus distance: The physical distance between two genes on a chromosome; affects the likelihood of crossing over.
The closer two genes are, the less likely crossing over will occur between them, resulting in fewer recombinant gametes. Conversely, genes farther apart are more likely to undergo crossing over, increasing recombinant gamete frequency.
Crossing Over and Genetic Variability
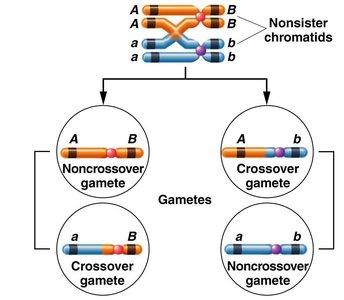
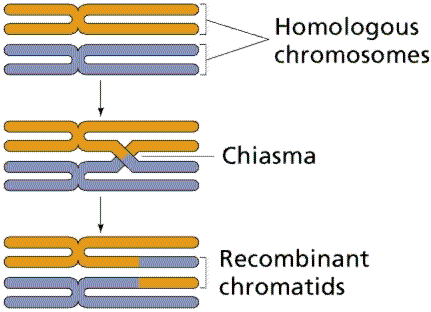
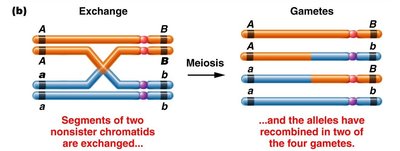
Crossing over occurs during meiosis between nonsister chromatids of homologous chromosomes, producing both parental and recombinant gametes. This process is a major source of genetic variability in sexually reproducing organisms.
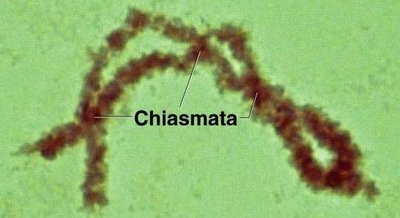
Chiasmata: Physical sites where chromatids exchange genetic material.
Synapsis: The pairing of homologous chromosomes during meiosis.
Chromosome Mapping and Recombination Frequency
The frequency of genetic exchange (recombination) between two genes is used to estimate their relative distance on a chromosome. Recombination frequencies are additive, and the farther apart genes are, the higher the recombination frequency.
Map unit (mu): Defined as 1% recombination between two genes.
Centimorgan (cM): Another term for map unit; represents relative distance, not exact physical distance.
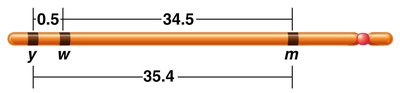
Example: If the recombination frequency between yellow and white is 0.5%, between white and miniature is 34.5%, and between yellow and miniature is 35.4%, the gene order can be deduced as yellow - white - miniature.
Single Crossover Events
A single crossover (SCO) alters linkage between two genes only if the crossover occurs between those two genes. If the crossover occurs elsewhere, the linkage arrangement remains unchanged, and only parental gametes are formed.
Noncrossover gametes: Gametes that retain the parental allele combinations.
Crossover gametes: Gametes with new allele combinations due to crossing over.

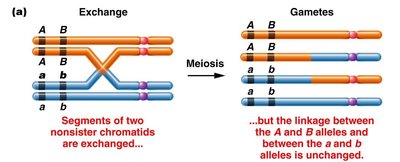
When a single crossover occurs between two nonsister chromatids, the other two chromatids remain unchanged and enter the gamete unchanged.

Genetic Crosses and Linkage Analysis
Genetic crosses can be used to analyze linkage and recombination. For example, crossing AAbb x aaBB with closely linked genes and no crossing over produces only parental types. If genes are unlinked, the classic Mendelian 9:3:3:1 ratio is observed in the F2 generation.
Parental types: Progeny with the same phenotype as one of the parents.
Recombinants: Progeny with phenotypes different from either parent.
In-Class Assignment: Predicting Phenotypic Ratios
Consider two hypothetical recessive autosomal genes a and b, where a heterozygote is testcrossed to a double homozygote mutant. Predict the phenotypic ratios under the following conditions:
A) a and b are located on separate autosomes: Independent assortment, 1:1:1:1 ratio.
B) a and b are linked on the same autosome, but are so far apart that a crossover always occurs between them: 1:1:1:1 ratio (appears unlinked).
C) a and b are linked on the same autosome, but are so close together that a crossover almost never occurs: Only parental types, 1:1 ratio.
D) a and b are linked on the same autosome about 10 mu apart: 10% recombinants, 90% parental types.
Why Didn’t Gregor Mendel Find Linkage?
Mendel studied seven genes in pea plants, and the pea has seven chromosomes. It is possible that the genes he studied were either on different chromosomes or so distantly located on the same chromosome that no linkage was detected.
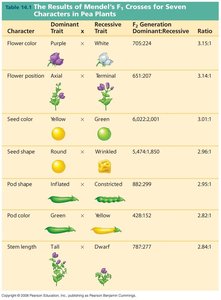
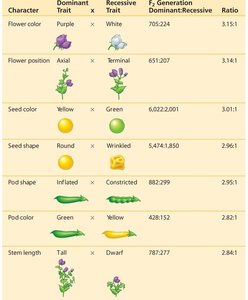
Summary Table: Mendel's Crosses
The following table summarizes Mendel's F1 crosses for seven characters in pea plants, showing dominant and recessive traits, F1 generation results, and ratios.
Character | Dominant Trait | Recessive Trait | F1 Generation Dominant:Recessive Ratio |
|---|---|---|---|
Flower color | Purple | White | 3.15:1 |
Flower position | Axial | Terminal | 3.14:1 |
Seed color | Yellow | Green | 3.01:1 |
Seed shape | Round | Wrinkled | 2.96:1 |
Pod shape | Inflated | Constricted | 2.95:1 |
Pod color | Green | Yellow | 2.82:1 |
Stem length | Tall | Dwarf | 2.84:1 |
Key Equations
The recombination frequency (RF) is calculated as:
One map unit (mu) or centimorgan (cM) is defined as:
Additional info: Academic context was added to clarify the significance of linkage, crossing over, and chromosome mapping, as well as to explain Mendel's results in relation to linkage analysis.
