 Back
BackMendelian Genetics, Linkage, and Genomic Mapping: Study Guide
Study Guide - Smart Notes
 Tailored notes based on your materials, expanded with key definitions, examples, and context.
Mendelian Genetics
Design of Mendel’s Pea Experiments
Gregor Mendel designed his experiments to study the principles of inheritance using pea plants. His approach was systematic and allowed for clear observation of trait transmission.
Pea plants were chosen because they grow quickly and produce many offspring.
He selected traits with two distinct forms (e.g., tall vs. dwarf, yellow vs. green).
Controlled pollination enabled Mendel to decide which plants crossed.
He collected thousands of measurements to observe clear patterns.
Monohybrid Cross Outcomes (F1 and F2 Generations)
A monohybrid cross examines the inheritance of a single trait with two forms.
F1 generation: Offspring are heterozygous and display the dominant trait.
F2 generation: Shows a 3:1 ratio—dominant trait appears in 75% of offspring, recessive in 25%.
Genotypes for Homozygous and Heterozygous Organisms
Genotypes describe the genetic makeup of an organism for a particular gene.
Homozygous: DD or dd
Heterozygous: Dd
Genotype and Phenotype Ratios in Monohybrid Crosses
Ratios help predict the distribution of traits among offspring.
Phenotype ratio: 3 tall : 1 dwarf
Genotype ratio: 1 DD : 2 Dd : 1 dd
Example: Out of 1064 progeny, 787 were tall and 277 were dwarf.
Punnett Square for Monohybrid Cross
Punnett Squares are used to visualize the possible genotypes of offspring from a genetic cross.
Each box represents a possible genotype.
For a cross between Dd x Dd:
D | d | |
|---|---|---|
D | DD | Dd |
d | Dd | dd |
Test Cross to Determine Genotype
A test cross is used to determine the genotype of an organism with a dominant phenotype.
Cross the unknown plant with a homozygous recessive (dd).
If all offspring show the dominant trait, the parent is DD.
If offspring are 1:1 dominant:recessive, the parent is Dd.
Independent Assortment During Meiosis
Genes on different chromosomes segregate independently during meiosis, leading to genetic variation.
Example parent genotype: GgWw
Possible gametes: GW, Gw, gW, gw
Random separation of homologous chromosomes creates these combinations.
Probability of Independent Events
The probability of two independent genetic events occurring together is the product of their individual probabilities.
Chance of G = 1/2; chance of W = 1/2
Combined probability:
Genotypes of Gametes in Dihybrid Crosses
For a parent heterozygous for two genes, four gamete combinations are possible.
GW, Gw, gW, gw
Always four combinations for a dihybrid heterozygote.
Dihybrid Cross Definition
A dihybrid cross tracks the inheritance of two different genes simultaneously.
Example: YyRr x YyRr (pea color and shape)
Phenotype and Genotype Ratios in Dihybrid Crosses
Dihybrid crosses produce characteristic ratios in offspring.
Phenotype ratio: 9:3:3:1
9 = dominant both traits (GW), 3 = dominant first, recessive second (Gww), 3 = recessive first, dominant second (ggW), 1 = recessive both (ggww)
Genotype breakdown: 1 GGWW, 2 GGWw, 2 GgWW, 4 GgWw, 1 GGww, 2 Ggww, 1 ggWW, 2 ggWw, 1 ggww
Deducing Parent Genotypes in Dihybrid Crosses
Parent genotypes can be inferred from offspring phenotypes and ratios.
Presence of recessive phenotypes indicates both parents carry the allele.
9:3:3:1 ratio suggests both parents are heterozygous (GgWw x GgWw).
1:1:1:1 ratio indicates a test cross (GgWw x ggww).
Pedigree Analysis
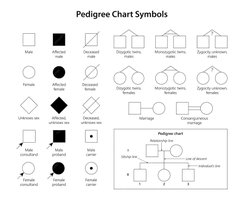
Pedigree Symbols and Construction
Pedigrees use standardized symbols to represent family relationships and inheritance patterns.
Squares represent males; circles represent females.
Shaded symbols indicate affected individuals; half-shaded indicate carriers.
Horizontal lines connect parents; vertical lines lead to offspring.
Identifying Carriers in Pedigrees
Carriers are individuals who possess a recessive allele but do not express the trait.
Unaffected individuals with affected offspring are likely carriers.
For X-linked recessive traits, carriers are usually female.
Inheritance of Sex-Linked Traits in Pedigrees
Sex-linked traits follow specific inheritance patterns in pedigrees.
X-linked recessive: More common in males; passed from carrier mother to son.
X-linked dominant: Affects both sexes; affected parent passes trait to ~50% of offspring.
Determining Genotypes for Sex-Linked Traits
Genotypes for sex-linked traits are denoted using X and Y chromosomes with superscripts.
Xa = normal allele; XA = affected allele
Analyze pedigree to deduce parent and offspring genotypes.
Distinguishing Sex-Linked vs. Autosomal Inheritance
Pedigrees can reveal whether a trait is sex-linked or autosomal based on inheritance patterns.
Sex-linked traits often show different frequencies in males and females.
Autosomal traits affect both sexes equally.
Genetic Linkage
Definition and Evidence of Genetic Linkage
Genetic linkage refers to genes located close together on the same chromosome, inherited together more often than expected by independent assortment.
Recombination frequency less than 50% indicates linkage.
Crossover Events and Chromosome Diagrams
Crossover occurs during meiosis when homologous chromosomes exchange DNA segments.
Results in two parental chromatids (unchanged) and two recombinant chromatids (new allele combinations).
Double crossover swaps segments twice, often flipping the middle gene—used to determine gene order.
Predicting Gametes After Crossover
Gamete genotypes depend on whether crossover occurs.
No crossover: parental gametes only.
Crossover: recombinant gametes are produced.
Genetic Mapping Based on Recombination Frequency
Genetic maps are constructed using recombination frequencies between genes.
% recombination = map distance (centimorgans, cM)
1% recombination = 1 cM
Higher recombination = genes are farther apart
Gene Order Determination Using Recombination Frequencies
Gene order is deduced by comparing recombination frequencies between pairs of genes.
Smallest % = closest genes; largest % = farthest apart
Double crossovers help identify the middle gene
Genomic Mapping and Complex Traits
Definition of Complex Trait
Complex traits are influenced by multiple genes and environmental factors.
Examples: height, skin color, disease risk
Single Nucleotide Polymorphism (SNP)
SNPs are single base differences in DNA, used as markers in genetic studies.
Example: A to G change at one position
Identification of SNPs in the Lab
SNPs are identified using DNA sequencing and microarrays.
DNA fragments bind to complementary sequences (hybridization)
SNP Maps and Trait Association
SNPs associated with traits or diseases are identified by their frequency in affected individuals.
SNPs appearing more often in people with the trait are linked to relevant genes
Genome-Wide Association Studies (GWAS)
GWAS require large sample sizes to detect associations between SNPs and complex traits.
Complex traits have small genetic effects
Large sample size increases statistical power and reduces random chance
