 Back
BackMendelian Genetics: Principles, Experiments, and Applications
Study Guide - Smart Notes
 Tailored notes based on your materials, expanded with key definitions, examples, and context.
Mendelian Genetics
Introduction to Mendelian Genetics
Mendelian genetics is the foundation of classical genetics, based on the pioneering work of Gregor Mendel in the 19th century. Mendel's experiments with garden peas established the basic principles of inheritance, which remain central to our understanding of genetic transmission.
The Garden Pea as a Model Organism
Mendel selected the garden pea (Pisum sativum) for his experiments due to its advantageous characteristics for genetic study:
Multiple distinct traits (e.g., flower color, seed shape)
Ease of cultivation and short generation time
Large number of offspring per mating
Ability to self-fertilize or cross-fertilize
Availability of true-breeding varieties

Key Traits Studied by Mendel
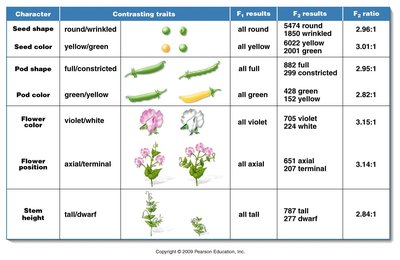
Mendel focused on several contrasting traits in peas, each with clear dominant and recessive forms. The table below summarizes these traits and Mendel's experimental results:
Character | Contrasting traits | F1 results | F2 results | F2 ratio |
|---|---|---|---|---|
Seed shape | round/wrinkled | all round | 5474 round, 1850 wrinkled | 2.96:1 |
Seed color | yellow/green | all yellow | 6022 yellow, 2001 green | 3.01:1 |
Pod shape | full/constricted | all full | 882 full, 299 constricted | 2.95:1 |
Pod color | green/yellow | all green | 428 green, 152 yellow | 2.82:1 |
Flower color | violet/white | all violet | 705 violet, 224 white | 3.15:1 |
Flower position | axial/terminal | all axial | 651 axial, 207 terminal | 3.15:1 |
Stem height | tall/dwarf | all tall | 787 tall, 277 dwarf | 2.84:1 |
Mendel's Experimental Approach
Monohybrid Crosses
A monohybrid cross involves parents differing in a single trait. Mendel cross-pollinated true-breeding plants with contrasting traits and observed the inheritance patterns in the F1 and F2 generations. The F1 generation always displayed only one of the parental traits (the dominant trait), while the F2 generation showed a 3:1 ratio of dominant to recessive phenotypes.
P generation: True-breeding parents
F1 generation: All hybrids show dominant trait
F2 generation: 3/4 dominant, 1/4 recessive
Mendel's Postulates
Mendel explained his results with four key postulates:
Unit Factors Exist in Pairs: Each individual carries two "unit factors" (now called genes) for each trait, one from each parent.
Dominance and Recessiveness: When two different unit factors are present, one is dominant and its effect is seen; the other is recessive and masked.
Segregation: The paired unit factors segregate (separate) during gamete formation, so each gamete receives only one factor.
Independent Assortment: During gamete formation, different pairs of unit factors assort independently of each other.
Genotype and Phenotype
The genotype is the genetic makeup of an organism (e.g., WW, Ww, or ww), while the phenotype is the observable trait (e.g., purple or white flowers). Homozygous individuals have two identical alleles; heterozygous individuals have two different alleles.
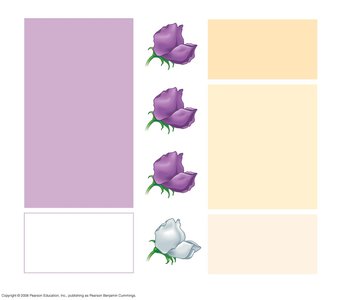
Punnett Squares and Ratios
Punnett squares are used to visualize the possible genotypes and phenotypes resulting from a genetic cross. For a monohybrid cross between two heterozygotes (Ww x Ww), the expected genotypic ratio is 1:2:1 (WW:Ww:ww), and the phenotypic ratio is 3:1 (dominant:recessive).
Dihybrid and Trihybrid Crosses
Dihybrid Crosses
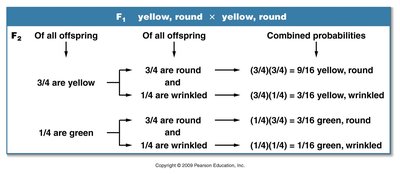
A dihybrid cross examines the inheritance of two different traits simultaneously. Mendel found that traits assort independently, resulting in a 9:3:3:1 phenotypic ratio in the F2 generation when both parents are heterozygous for both traits.
Example: Seed color (yellow/green) and seed shape (round/wrinkled)
Possible gametes from GgWw: GW, Gw, gW, gw
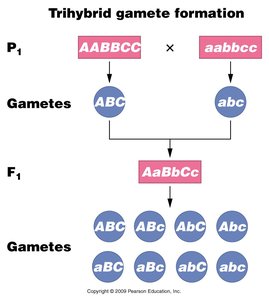
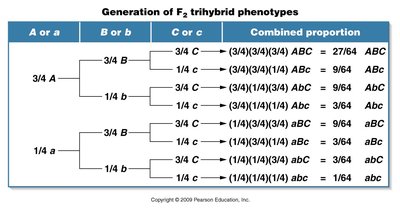
Trihybrid Crosses
Trihybrid crosses involve three traits and demonstrate that Mendel's principles apply to multiple traits. The forked-line method is often used for analysis, as Punnett squares become unwieldy. The F2 generation shows a 27:9:9:9:3:3:3:1 phenotypic ratio.
Chromosomal Theory of Inheritance
Linking Mendel's Principles to Chromosomes
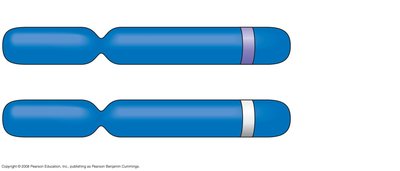
The chromosomal theory of inheritance, proposed by Sutton and Boveri, states that genes are located on chromosomes, which segregate and assort independently during meiosis. This theory provided a physical basis for Mendel's observations.
Diploid organisms: Two sets of chromosomes (2n)
Gametes: Haploid (n), formed by meiosis
Fertilization: Restores diploid number

Genetic Variation
Independent assortment during meiosis leads to extensive genetic variation. The number of possible gamete combinations is , where n is the haploid chromosome number. In humans (n = 23), this results in over 8 million possible gametes per parent.
Probability in Genetics
Product and Sum Laws
The product law states that the probability of two independent events both occurring is the product of their individual probabilities. The sum law states that the probability of either of two mutually exclusive events occurring is the sum of their individual probabilities.
Example: Probability of two heterozygous parents having two homozygous recessive offspring:
Conditional Probability
Conditional probability is used when the outcome depends on a specific condition. For example, the probability that a tall F2 plant is heterozygous (Dd) requires considering only the tall plants and their genotypes.
Statistical Analysis in Genetics
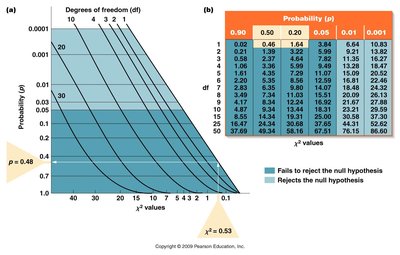
Chi-Square Analysis
The chi-square () test is used to evaluate whether observed genetic ratios deviate significantly from expected ratios due to chance. The formula is:
o: observed value
e: expected value
Degrees of freedom (df) = number of categories - 1. The resulting value is compared to a probability table to determine if the null hypothesis (no significant difference) should be rejected.
Pedigree Analysis
Pedigrees in Human Genetics
A pedigree is a family tree diagram that shows the inheritance of a trait across generations. Pedigree analysis is a valuable tool for studying human genetic disorders and determining inheritance patterns (dominant, recessive, X-linked, etc.).
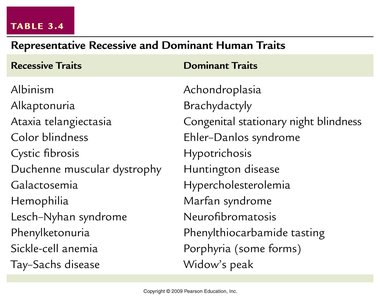
Summary Table: Representative Human Traits
The following table lists examples of human traits inherited as dominant or recessive:
Recessive Traits | Dominant Traits |
|---|---|
Albinism | Achondroplasia |
Cystic fibrosis | Huntington disease |
Sickle-cell anemia | Widow's peak |
Tay-Sachs disease | Marfan syndrome |
Key Equations and Concepts
Monohybrid phenotypic ratio: 3:1
Dihybrid phenotypic ratio: 9:3:3:1
Trihybrid phenotypic ratio: 27:9:9:9:3:3:3:1
Number of possible gametes:
Chi-square formula:
Additional info: This guide covers the core principles of Mendelian genetics, including experimental design, inheritance patterns, probability, and statistical analysis, as well as their application to human genetics.
