 Back
BackProbability Theory and Statistical Analysis in Mendelian Genetics
Study Guide - Smart Notes
 Tailored notes based on your materials, expanded with key definitions, examples, and context.
Probability Theory Predicts Mendelian Ratios
Introduction to Probability in Genetics
Probability theory is fundamental to predicting genetic outcomes, especially those described by Mendelian inheritance. Four main rules—product rule, sum rule, conditional probability, and binomial probability—allow geneticists to calculate the likelihood of specific genotypes and phenotypes in offspring.
Product Rule (Multiplication Rule)
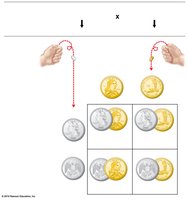
The product rule is used when calculating the probability of two or more independent events occurring simultaneously. In genetics, this is often applied to determine the probability of a particular genotype resulting from a cross.
Formula:
Application: Used in Punnett square analysis to determine the chance of an F2 plant exhibiting a recessive phenotype.
Example: If the probability of inheriting allele B from one parent is 1/2 and from the other parent is 1/2, the probability of being BB is .
Sum Rule (Addition Rule)
The sum rule is used for mutually exclusive events, where only one event can occur at a time. It calculates the probability of either event A or event B occurring.
Formula:
Application: Used to determine the probability of obtaining either one genotype or another in offspring.
Example: The probability of having either a girl or a boy in a single birth is .
Conditional Probability
Conditional probability is applied when additional information about the outcome modifies the probability calculation. This is often used after a cross has been made and some outcomes are already known.
Application: For a Gg × Gg cross, the probability that a yellow-seeded progeny is heterozygous (Gg) is calculated by considering only the yellow-seeded offspring (GG or Gg), excluding gg.
Result: Probability of Gg among yellow-seeded offspring is .
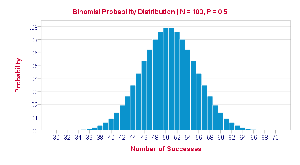
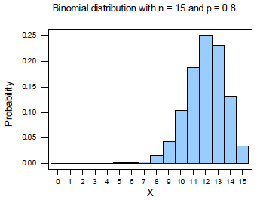
Binomial Probability
Binomial probability is used to predict the likelihood of a series of events, such as the distribution of phenotypes in a large number of offspring. It expands the binomial expression to reflect the number of outcome combinations and the probability of each.
Formula: where n = total events, s = times event x occurs, t = times event y occurs, p = probability of event x, q = probability of event y.
Example: Probability of 5 girls and 1 boy in 6 children: .
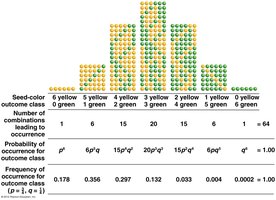
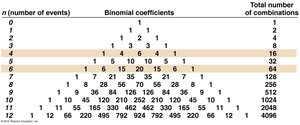
Binomial Expansion and Pascal's Triangle
The binomial expansion is used to calculate the probabilities of all possible outcomes for n events. Pascal's triangle provides binomial coefficients for these calculations, simplifying the process.
Example: For six seeds per pod, expands to .
Application: Used to predict the frequency of different seed color combinations in a pod.
Statistical Analysis in Genetics
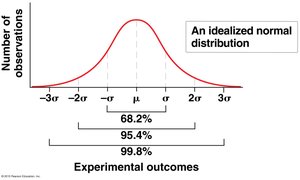
Normal Distribution
The normal distribution describes the spread of experimental outcomes around the mean. In genetics, it is used to assess whether observed results deviate significantly from expected values.
Mean (µ): The average outcome.
Standard deviation (σ): Measures the spread of outcomes.
Statistical significance: Results more than ~2σ from µ are considered significant (p-value < 0.05).
Chi-Square (χ²) Test
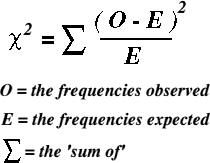
The chi-square test is used to evaluate whether observed genetic data fit expected Mendelian ratios. It quantifies the difference between observed and expected values and determines statistical significance.
Formula: where O = observed frequency, E = expected frequency.
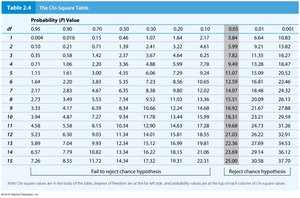
Degrees of freedom (df): , where n is the number of outcome classes.
Interpretation: Compare χ² value to a table to determine p-value and assess significance.


Application: Testing Mendel's Data
Chi-square analysis is applied to Mendel's classic experiments to test the fit between observed and expected ratios. For example, in a cross of round vs. wrinkled seeds, the expected ratio is 3:1. Observed data are compared to predictions using the χ² test.
Example: If 7324 seeds are counted, expected values are 5493 round and 1831 wrinkled. Observed values are 5474 round and 1850 wrinkled. Calculating χ² yields a value that is not significantly different from expectations.
Significance: If χ² is high and p-value is low (< 0.05), results are significantly different, indicating possible deviation from Mendelian inheritance.

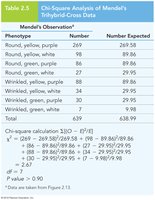
Chi-Square Analysis of Trihybrid Cross
Chi-square analysis can be extended to more complex crosses, such as Mendel's trihybrid cross, to evaluate the fit of observed phenotypic ratios to expected values.
Phenotype | Mendel's Observation | Number Expected |
|---|---|---|
Round, yellow, purple | 269 | 269.99 |
Round, yellow, white | 98 | 89.66 |
Round, green, purple | 28 | 29.95 |
Round, green, white | 25 | 29.95 |
Wrinkled, yellow, purple | 84 | 89.66 |
Wrinkled, yellow, white | 34 | 29.95 |
Wrinkled, green, purple | 19 | 29.95 |
Wrinkled, green, white | 9 | 9.99 |
Total | 566 | 569.99 |
Summary Table: Probability Rules in Genetics
Rule | Formula | Application |
|---|---|---|
Product Rule | Independent events (e.g., Punnett square) | |
Sum Rule | Mutually exclusive events | |
Conditional Probability | Depends on prior outcome | Modified by known information |
Binomial Probability | Series of events (e.g., seed color in pods) | |
Chi-Square Test | Statistical significance of observed vs. expected |
Additional info: These notes expand on the original lecture content by providing full academic explanations, formulas, and relevant examples for each probability rule and statistical test used in Mendelian genetics. Images included directly reinforce the concepts discussed, such as Punnett squares, binomial distributions, and chi-square tables.
