 Back
BackRevision of Mendelian Genetics: Principles, Crosses, and Statistical Analysis
Study Guide - Smart Notes
 Tailored notes based on your materials, expanded with key definitions, examples, and context.
Revision of Mendelian Genetics
Introduction to Mendelian Genetics
Mendelian genetics forms the foundation of classical genetics, describing how traits are inherited from one generation to the next through discrete units called genes. Gregor Mendel's experiments with pea plants led to the formulation of key principles that explain the patterns of inheritance observed in sexually reproducing organisms.

Mendel Observed Phenotypic Variation
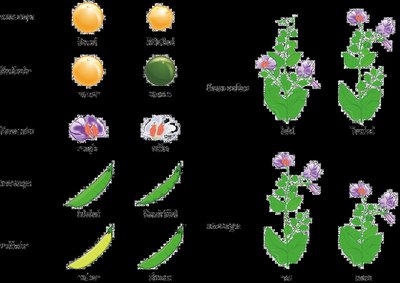
Mendel studied the inheritance of distinct traits in pea plants, such as seed shape, seed color, and flower color. He observed that these traits appeared in specific ratios in the offspring, indicating predictable patterns of inheritance.
Mendel's Experimental Crosses
Monohybrid Crosses
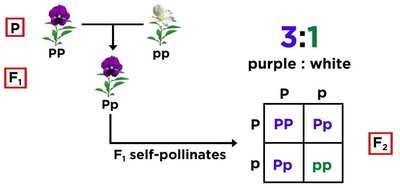
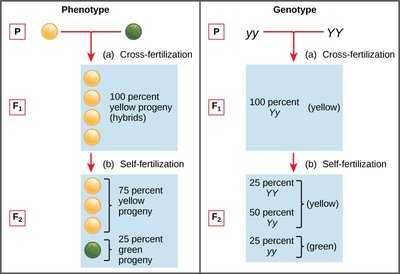
A monohybrid cross examines the inheritance of a single trait. Mendel crossed pure-breeding plants with contrasting traits (e.g., purple vs. white flowers) and observed the resulting generations. The F1 generation was uniform, while the F2 generation showed a 3:1 phenotypic ratio, revealing the presence of dominant and recessive alleles.
Dihybrid Crosses
Dihybrid crosses involve two traits and demonstrate the independent assortment of genes. Mendel found that the F2 generation exhibited a 9:3:3:1 phenotypic ratio, supporting the idea that alleles for different traits segregate independently during gamete formation.

Mendel's Postulates
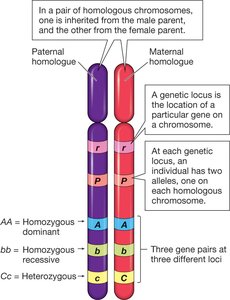
1. Gene Pairs
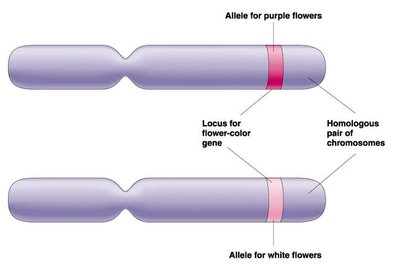
Genetic traits are controlled by genes that exist in pairs in individual organisms. Each individual inherits one allele from each parent, forming a pair for each gene.
2. Dominance and Recessiveness
When two different alleles are present for a single trait, one may be dominant and mask the expression of the other, which is recessive. The dominant allele determines the phenotype in heterozygotes.

3. Segregation
During gamete formation, the two alleles for a gene separate (segregate) so that each gamete receives only one allele. This explains the 3:1 ratio observed in the F2 generation of monohybrid crosses.

4. Independent Assortment
Alleles of different genes assort independently of one another during gamete formation, resulting in all possible combinations of alleles in the offspring. This principle is evident in the 9:3:3:1 ratio of dihybrid crosses.

Genetic Terminology
Key Terms
Homozygous: Having two identical alleles for a gene (e.g., AA or aa).
Heterozygous: Having two different alleles for a gene (e.g., Aa).
Genotype: The genetic makeup of an organism.
Phenotype: The observable traits of an organism.
Test Crosses
Purpose and Interpretation
A test cross is used to determine the genotype of an individual with a dominant phenotype by crossing it with a homozygous recessive individual. The resulting offspring phenotypes reveal whether the tested individual is homozygous dominant or heterozygous.
Probability Rules in Genetics
Product Rule
The probability of two independent events both occurring is the product of their individual probabilities. This rule is essential for predicting the outcomes of genetic crosses involving multiple traits.

Chi-Square (χ²) Analysis
Purpose and Application
The chi-square test is used to evaluate whether observed genetic data fit expected ratios, allowing for the assessment of the influence of chance on genetic outcomes. The null hypothesis (H₀) states that there is no significant difference between observed and expected values.
If χ² is low and p > 0.05, fail to reject H₀ (deviation is due to chance).
If χ² is high and p < 0.05, reject H₀ (deviation is significant).

Chi-Square Formula
The chi-square statistic is calculated as:
Where:
o = observed value
e = expected value
Σ = sum over all categories
Degrees of Freedom
Degrees of freedom (df) are calculated as the number of categories minus one (n - 1). The df value is used to interpret the significance of the χ² value using a probability table.
Interpreting Results
p < 0.05: Significant deviation; reject H₀.
p > 0.05: Not significant; fail to reject H₀.

Pedigree Analysis
Symbols and Interpretation
Pedigree analysis is used to study the inheritance of traits in families. Standard symbols represent individuals, their relationships, and their phenotypes, allowing geneticists to infer modes of inheritance (e.g., autosomal dominant, autosomal recessive).

Class Exercise: Application of Mendelian Principles
Genetic Analysis in Dogs
Students are asked to analyze the inheritance of two traits (tail kink and PDA) in Great Danes using Mendelian principles and statistical tests. This exercise reinforces the application of monohybrid and dihybrid crosses, test crosses, and chi-square analysis in real-world scenarios.
Summary Table: Mendel's Traits and Ratios
Character | Contrasting traits | F1 results | F2 results | F2 ratio |
|---|---|---|---|---|
Seeds | Round/Wrinkled | All round | 5474 round, 1850 wrinkled | 2.96:1 |
Seeds | Yellow/Green | All yellow | 6022 yellow, 2001 green | 3.01:1 |
Pods | Full/Constricted | All full | 882 full, 299 constricted | 2.95:1 |
Pods | Green/Yellow | All green | 428 green, 152 yellow | 2.82:1 |
Flower color | Violet/White | All violet | 705 violet, 224 white | 3.15:1 |
Flower position | Axial/Terminal | All axial | 651 axial, 207 terminal | 3.14:1 |
Stem length | Tall/Dwarf | All tall | 787 tall, 277 dwarf | 2.84:1 |
