

 15:24
15:24

Textbook Question
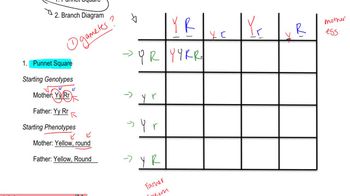
Two genes interact to produce various phenotypic ratios among F₂ progeny of a dihybrid cross. Design a different pathway explaining each of the F₂ ratios below, using hypothetical genes R and T and assuming that the dominant allele at each locus catalyzes a different reaction or performs an action leading to pigment production. The recessive allele at each locus is null (loss-of-function). Begin each pathway with a colorless precursor that produces a white or albino phenotype if it is unmodified. The ratios are for F₂ progeny produced by crossing wild-type F₁ organisms with the genotype RrTt.
9/16 red : 7/16 white
433
views