 Back
BackAggregate Demand and Aggregate Supply Model: Comprehensive Study Notes
Study Guide - Smart Notes
 Tailored notes based on your materials, expanded with key definitions, examples, and context.
Aggregate Demand and Aggregate Supply Model
Introduction
The Aggregate Demand-Aggregate Supply (AD-AS) model is a fundamental framework in macroeconomics, providing insights into inflation, recession, and unemployment. It explains how the overall price level and real output are determined in the economy and how they respond to various economic shocks.
Aggregate Demand (AD)
Why the Aggregate Demand Curve is Downward Sloping
Aggregate Demand is the total quantity of goods and services demanded across all levels of an economy at various price levels.
The AD curve is downward sloping due to three main effects:
Interest Rate Effect: Higher price levels increase the demand for money, raising interest rates, which reduces investment and consumption spending, thus lowering AD.
Real Balance Effect: Higher prices decrease the real value of money holdings, making consumers feel poorer and reducing spending.
Foreign Purchases Effect: Higher domestic prices make exports less attractive and imports more attractive, reducing net exports and AD.
Any change in the price level, holding other factors constant, will change the quantity of real GDP demanded.
Changes in Aggregate Demand
Determinants and the Multiplier Effect
Aggregate demand can shift due to changes in its determinants, amplified by the multiplier effect.
Determinants of Aggregate Demand:
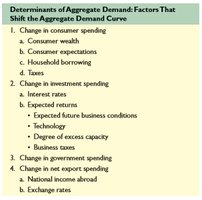
The Multiplier Effect: The spending multiplier magnifies initial changes in spending into larger changes in aggregate demand. The formula is:
For example, if the marginal propensity to consume (MPC) is 0.75, the multiplier is 4. An initial increase in spending of $5 billion leads to a total increase in aggregate demand of $20 billion.
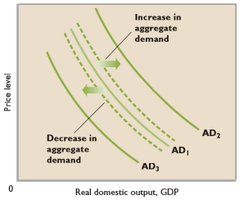
The rightward shift from AD1 to AD2 represents an increase in aggregate demand, while a leftward shift to AD3 shows a decrease.
Aggregate Supply (AS)
Time Horizons and Curve Shapes
Aggregate supply shows the relationship between the price level and the quantity of real output supplied by firms. The shape of the AS curve depends on the time horizon:
Immediate Short Run: Both input and output prices are fixed; the AS curve is horizontal.
Short Run (SRAS): Input prices are fixed, but output prices can vary; the AS curve is upward sloping.
Long Run (LRAS): Both input and output prices can vary; the AS curve is vertical at the full-employment output level.
Determinants of Aggregate Supply:
Changes in input prices (domestic and imported resources)
Changes in productivity
Changes in the legal-institutional environment (taxes, subsidies, regulations)
Equilibrium in the AD-AS Model
Establishing Equilibrium
The intersection of the AD and AS curves determines the equilibrium price level and real output in the economy.
At equilibrium, the economy operates at the output level where aggregate demand equals aggregate supply.
Demand-Pull Inflation
When aggregate demand increases (AD1 to AD2), the price level rises, causing demand-pull inflation and possibly an inflationary GDP gap.
Recession and Cyclical Unemployment
A decrease in aggregate demand can lead to recession, idle capacity, and cyclical unemployment. The effect depends on price flexibility.
Cost-Push Inflation
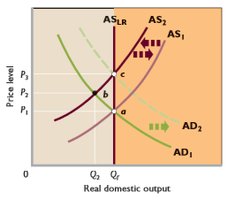
When aggregate supply decreases (AS1 to AS2), prices rise (cost-push inflation), and output falls, creating a recessionary gap.
Full Employment with Price-Level Stability
Increases in aggregate supply, often due to productivity growth, can allow the economy to achieve higher output and full employment with only mild inflation.
The Long-Run Aggregate Supply Curve
Short Run vs. Long Run
In the short run, nominal wages and input prices are slow to adjust, so the SRAS curve is upward sloping.
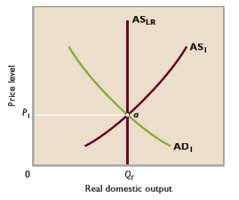
In the long run, all prices are flexible, and the LRAS curve is vertical at the full-employment output (QF).
Long-run equilibrium occurs where AD, SRAS, and LRAS intersect, with no GDP gap.
Inflation in the Extended AD-AS Model
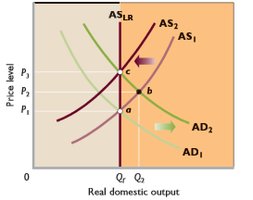
Demand-Pull Inflation
An increase in AD raises both the price level and real output in the short run. In the long run, rising nominal wages shift SRAS leftward, returning output to its original level but at a higher price level.
Cost-Push Inflation
Leftward shifts in SRAS cause cost-push inflation. If the government increases AD to maintain output, inflation worsens. If not, recession persists until wages and prices adjust downward.
Recession and Policy Dilemma
Recessions caused by falling AD can be prolonged if prices and wages are inflexible downward. Active monetary and fiscal policy may be needed to restore full employment.
Economic Growth in the Extended AD-AS Model
Economic growth shifts both LRAS and SRAS rightward, increasing potential output. If AD also increases, the economy experiences growth with mild inflation.
Inflation in this context is due to rising AD, not real GDP growth.
The Inflation-Unemployment Relationship in the Extended Model
The Phillips Curve
The Phillips Curve illustrates a short-run trade-off between inflation and unemployment: lower unemployment is associated with higher inflation, and vice versa.
Aggregate supply shocks can cause both high inflation and high unemployment (stagflation).
In the long run, there is no trade-off; the long-run Phillips Curve is vertical at the natural rate of unemployment.
Periods of low inflation and low unemployment are rare and typically result from significant productivity growth.
Summary Table: Short-Run vs. Long-Run Phillips Curve
Time Frame | Relationship | Curve Shape |
|---|---|---|
Short Run | Inverse (trade-off) | Downward sloping |
Long Run | No trade-off | Vertical at natural rate |
Additional info: The AD-AS model is central to modern macroeconomic analysis, integrating the effects of fiscal and monetary policy, productivity changes, and external shocks on the overall economy. Understanding the dynamics of AD and AS is crucial for interpreting real-world economic fluctuations and policy debates.
