 Back
BackBasic Macroeconomic Relationships: Consumption, Saving, Investment, and the Multiplier
Study Guide - Smart Notes
 Tailored notes based on your materials, expanded with key definitions, examples, and context.
Basic Macroeconomic Relationships
Introduction
This chapter explores fundamental relationships in macroeconomics, focusing on how income affects consumption and saving, how interest rates influence investment, and how changes in spending impact GDP. Understanding these relationships is essential for analyzing economic trends and policy effects.
Income-Consumption and Income-Saving Relationships
Disposable Income and Its Effects
Disposable income (DI) is the most significant determinant of both consumption and saving in an economy. As DI increases, consumers tend to spend more, but the proportion of income spent decreases as income rises. Conversely, saving increases with DI, but the proportion saved is higher at larger incomes.
Consumption Function: Shows that consumer spending rises with DI, but the fraction of income spent falls as DI increases.
Savings Function: Indicates a direct relationship between saving and DI, with a higher proportion saved at higher DI levels.
Average and Marginal Propensities
Average Propensity to Consume (APC): The fraction of total income consumed.
Average Propensity to Save (APS): The fraction of total income saved.
Marginal Propensity to Consume (MPC): The fraction of any change in income that is consumed.
Marginal Propensity to Save (MPS): The fraction of any change in income that is saved.
Key Relationship: and at any level of DI.
Non-Income Determinants of Consumption and Saving
Several factors can shift the consumption and saving schedules:
Wealth: Increased wealth raises consumption.
Borrowing (Household Debt): More borrowing can temporarily increase consumption.
Expectations: Optimism about future income increases consumption.
Real Interest Rates: Lower real interest rates encourage consumption.
Taxes: Higher taxes reduce both consumption and saving.
Interest-Rate–Investment Relationship
Determinants of Investment
Investment decisions are primarily influenced by the expected rate of return and the real interest rate. The investment demand curve illustrates the inverse relationship between the real interest rate and the quantity of investment demanded.
Expected Rate of Return: Higher expected returns increase investment.
Real Interest Rate: Lower real interest rates make investment more attractive.
The Investment Demand Curve
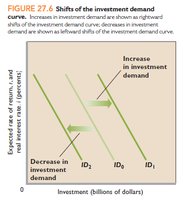
The investment demand curve is constructed by ranking investment projects by their expected rates of return. It slopes downward, indicating that as the real interest rate falls, the quantity of investment demanded rises.
Shifts of the Investment Demand Curve
Non-interest-rate determinants can shift the investment demand curve:
Acquisition, Maintenance, and Operating Costs: Higher costs reduce investment.
Business Taxes: Increased taxes lower investment profitability.
Technological Change: Stimulates investment.
Stock of Capital on Hand: Excess capacity reduces investment.
Planned Inventory Changes: Plans to increase inventories shift the curve right.
Expectations: Optimism about future sales and profits shifts the curve right.
Instability of Investments
Investment is the most volatile component of total spending, contributing significantly to business cycle fluctuations. Several factors explain this volatility:
Durability of Capital: Optimism leads to replacement and modernization, increasing investment.
Irregularity of Innovation: Technological progress occurs irregularly, causing investment waves.
Variability of Profits: Fluctuating profits affect both the incentive and means to invest.
Variability of Expectations: Changes in business conditions, policies, and market confidence can quickly alter investment plans.
The Multiplier Effect
Definition and Formula
The multiplier effect describes how an initial change in spending leads to a larger change in GDP. This occurs because spending circulates through the economy, generating additional income and consumption at each step.
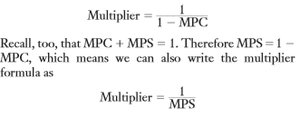
Multiplier Formula:
Alternative Formula: Since ,
Rationale for the Multiplier
The multiplier effect is based on two facts:
The economy supports continuous flows of expenditures and income, so dollars spent by one person become income for another.
Any change in income alters both consumption and saving, leading to a chain reaction of spending throughout the economy.
As a result, initial changes in spending produce magnified changes in output and income.
Summary Table: Key Macroeconomic Relationships
Relationship | Key Formula | Explanation |
|---|---|---|
APC + APS | All disposable income is either consumed or saved. | |
MPC + MPS | All changes in income are either consumed or saved. | |
Multiplier |
| Measures the total change in GDP from an initial change in spending. |
