 Back
BackComprehensive Study Notes: Core Concepts in Macroeconomics
Study Guide - Smart Notes
 Tailored notes based on your materials, expanded with key definitions, examples, and context.
Introduction to Macroeconomics
Microeconomics vs. Macroeconomics
Macroeconomics studies the economy as a whole, focusing on aggregate outcomes such as total output, employment, and price levels, while microeconomics examines individual markets and decision-makers. Macroeconomics is characterized by its emphasis on time frames (short run vs. long run), expectations, empirical analysis, and policy relevance.
Short Run: Business cycle fluctuations, aggregate demand, and demand management.
Long Run: Economic growth and potential output.
Expectations: Influence current economic behavior and outcomes.
Policy Driven: Focus on evaluating and recommending economic policies.
Measuring Economic Activity: GDP
Definition and Components of GDP
Gross Domestic Product (GDP) is the market value of all final goods and services produced within a country in a given year. Only final goods are counted to avoid double-counting, and only production within the country is included.
Expenditure Method: GDP is calculated as the sum of consumption (C), investment (I), government purchases (G), and net exports (NX):
Consumption (C): Spending by households on goods and services.
Investment (I): Purchases of capital goods, new housing, and changes in inventories.
Government Purchases (G): Spending on goods and services by all levels of government (excludes transfer payments).
Net Exports (NX): Exports minus imports.
Per Capita GDP is GDP divided by the population, providing a measure of average economic output per person:
Nominal vs. Real GDP and Price Indices
Nominal and Real GDP
Nominal GDP values output using current prices, while Real GDP uses constant base-year prices to account for inflation, allowing for meaningful comparisons over time.
Nominal GDP (Year t):
Real GDP (Year t, base year b):
GDP Deflator
The GDP Deflator measures the price level of all goods and services included in GDP:
Used to calculate the inflation rate between two years:
Consumer Price Index (CPI)
The CPI tracks changes in the cost of a fixed basket of goods and services purchased by a typical consumer. It is widely used to measure inflation and adjust contracts for cost-of-living changes.
Inflation and Interest Rates
Inflation, Disinflation, and Deflation
Inflation: Sustained increase in the general price level.
Disinflation: A reduction in the rate of inflation (prices rise more slowly).
Deflation: A decrease in the general price level (prices fall).
Real vs. Nominal Interest Rates
The nominal interest rate is the stated rate, while the real interest rate adjusts for inflation:
Where is the nominal rate, is the real rate, and is the inflation rate.
If , then (real returns are negative).
Inflation benefits borrowers and hurts savers/creditors.
Unemployment
Definition and Measurement
Employed: Worked for pay in the last week.
Unemployed: Did not work but actively sought work in the last month.
Labor Force: Employed + Unemployed.
Unemployment Rate:
Labor Force Participation Rate:
Types of Unemployment
Frictional: Short-term, between jobs or entering the labor force.
Structural: Mismatch between skills and job requirements.
Cyclical: Related to business cycle fluctuations.
The natural rate of unemployment includes frictional and structural unemployment.
Economic Growth
Growth Rate of Real GDP
Economic growth is measured as the annual percentage change in real GDP:
Rule of 70
The Rule of 70 estimates the number of years for a variable to double, given its growth rate:
Per Worker Production Function and Productivity
Productivity, or output per worker, is a key determinant of living standards. The per worker production function shows the relationship between capital per worker and output per worker, with diminishing returns to capital.
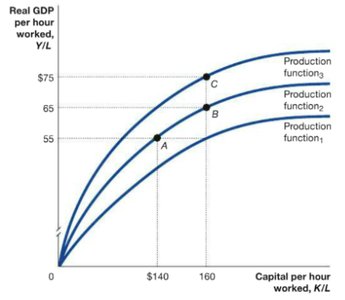
Technological Change: Shifts the production function upward, increasing productivity at all levels of capital.
Convergence Hypothesis
The convergence hypothesis suggests that poorer countries should grow faster than richer ones, eventually catching up in terms of GDP per capita, due to technology transfer and higher returns to capital.
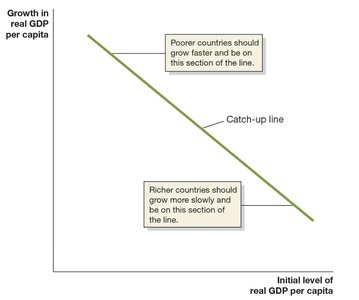
Absolute Convergence: All countries will catch up regardless of other factors.
Contingent Convergence: Catch-up depends on factors like institutions, policies, and openness to trade.
Aggregate Demand and Aggregate Supply
Aggregate Demand (AD)
The AD curve shows the relationship between the price level and the quantity of real GDP demanded. It slopes downward due to the wealth effect, interest rate effect, and international trade effect.
Wealth Effect: Higher prices reduce real wealth and consumption.
Interest Rate Effect: Higher prices increase interest rates, reducing investment and consumption.
International Trade Effect: Higher prices make domestic goods less competitive, reducing net exports.
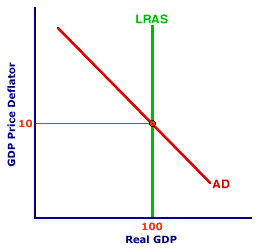
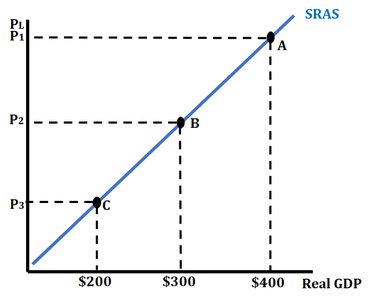
Aggregate Supply (AS)
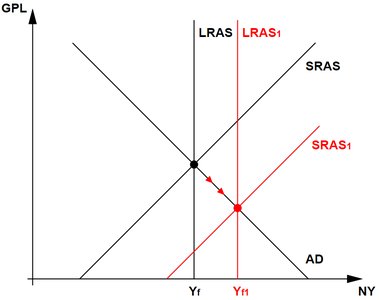
Long-Run Aggregate Supply (LRAS): Vertical at potential GDP, determined by capital, labor, and technology.
Short-Run Aggregate Supply (SRAS): Upward sloping due to sticky wages and prices.
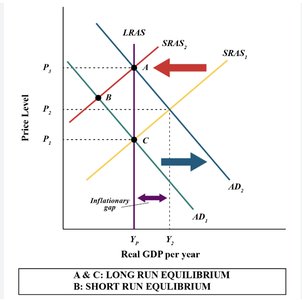
Macroeconomic Equilibrium and Gaps
Equilibrium: Where AD, SRAS, and LRAS intersect.
Inflationary Gap: Output above potential, unemployment below natural rate, upward pressure on prices.
Recessionary Gap: Output below potential, unemployment above natural rate, downward pressure on prices.
The Phillips Curve: Inflation and Unemployment Trade-off
Short-Run and Long-Run Phillips Curve
The Phillips Curve illustrates the inverse relationship between inflation and unemployment in the short run. In the long run, the curve is vertical at the natural rate of unemployment, indicating no trade-off between inflation and unemployment.
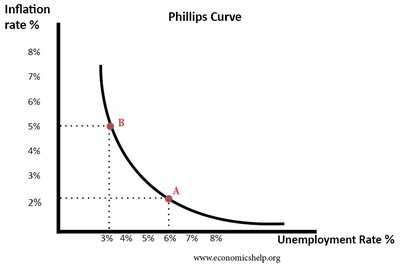
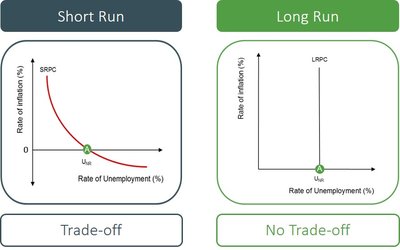
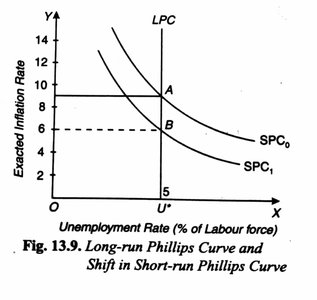
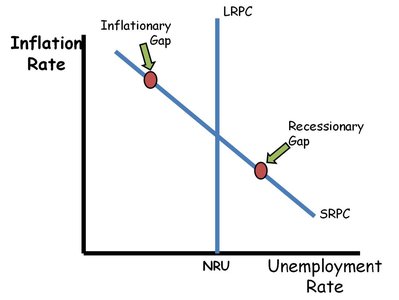
Short-Run: Policymakers can exploit the trade-off, but only temporarily.
Long-Run: Unemployment returns to the natural rate regardless of inflation.
Expected Inflation: Shifts the short-run Phillips Curve; higher expected inflation shifts it upward.
Summary Table: CPI vs. GDP Deflator
CPI | GDP Deflator |
|---|---|
Includes only goods typically bought by consumers | Includes all goods produced domestically |
Includes imported goods | Excludes imported goods |
Uses a fixed basket of goods | Uses a changing basket of goods |
Conclusion
This guide covers the foundational concepts of macroeconomics, including GDP measurement, inflation, unemployment, economic growth, aggregate demand and supply, and the Phillips Curve. Mastery of these topics is essential for understanding the behavior of the overall economy and the effects of policy interventions.
