 Back
BackCore Concepts in Macroeconomics: Economic Issues, Theories, and Measurement
Study Guide - Smart Notes
 Tailored notes based on your materials, expanded with key definitions, examples, and context.
Economic Issues and Concepts
What is Economics?
Economics is the study of how societies use scarce resources to satisfy unlimited human wants. The fundamental problem is scarcity, which forces individuals and societies to make choices, each with associated opportunity costs.
Resources (Factors of Production): Land (natural resources), Labour (human effort), Capital (tools, machinery), and Entrepreneurship (coordination of resources).
Goods and Services: Goods are tangible products; services are intangible. Both satisfy human wants.
Opportunity Cost: The value of the next best alternative forgone when a choice is made. Includes both explicit (monetary) and implicit (non-monetary) costs.
Example: If Julia attends college, her opportunity cost includes tuition, rent, textbooks, and the income she forgoes by not working.
Scarcity, Choice, and Opportunity Cost
Scarcity implies that not all wants can be satisfied, necessitating choices. Every choice involves an opportunity cost, which is the sum of explicit and implicit costs.
Formula:
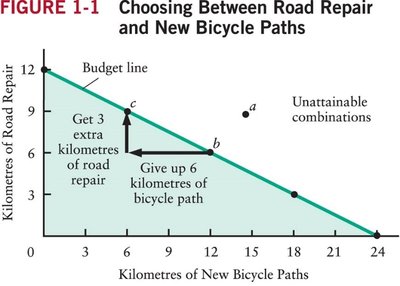
Example: Choosing between road repairs and new bicycle paths with a fixed budget illustrates trade-offs and opportunity costs.
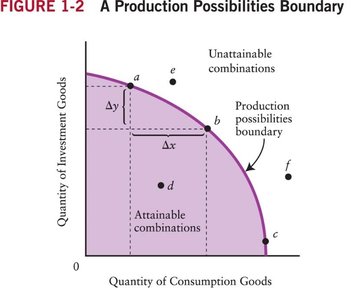
Production Possibilities Boundary (PPB)
The PPB illustrates the maximum attainable combinations of two goods that can be produced with available resources and technology. It demonstrates scarcity, choice, and opportunity cost.
Diminishing Marginal Returns: As more resources are allocated to one good, the additional output from those resources decreases.
Attainable vs. Unattainable Points: Points inside or on the PPB are attainable; points outside are unattainable.
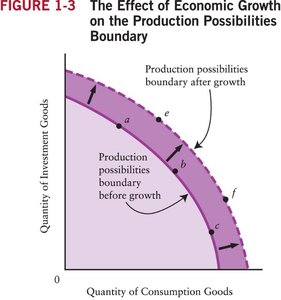
Economic Growth and the PPB
Economic growth shifts the PPB outward, allowing previously unattainable combinations of goods to become attainable.
Four Key Economic Problems
What is produced and how? Resource allocation determines the mix of goods and services produced.
What is consumed and by whom? Distribution of output among individuals and groups.
Why are resources sometimes idle? Idle resources indicate the economy is operating inside its PPB.
Is productive capacity growing? Growth is shown by an outward shift of the PPB.
The Complexity of Modern Economies
The Nature of Market Economies
Modern economies are complex and largely self-organizing. Individual decisions by consumers and producers, motivated by self-interest and responding to incentives, coordinate economic activity through markets.
Efficiency: Resources are allocated to maximize output with minimal waste.
Prices as Signals: Prices convey information about relative scarcity and guide resource allocation.
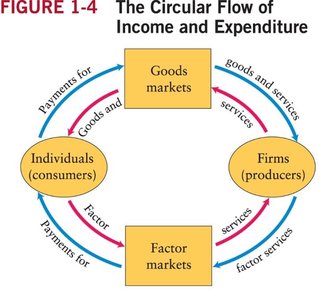
The Circular Flow of Income and Expenditure
The circular flow model illustrates the movement of goods, services, and money between households and firms through goods and factor markets.
Specialization, Division of Labour, and Trade
Specialization and division of labour increase efficiency and output. Trade, facilitated by money, allows individuals and nations to benefit from specialization.
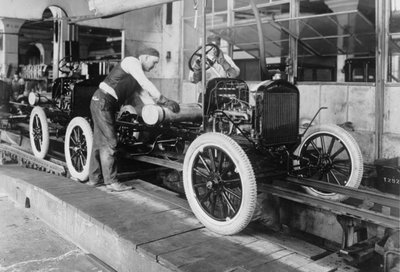
Example: Henry Ford’s assembly line increased productivity by dividing production into specialized tasks.
Types of Economic Systems
Traditional: Low specialization, self-sufficient households.
Command (Centrally Planned): Central authority makes economic decisions.
Free-Market: Decentralized decision-making coordinated by prices.
Mixed Economy: Combines elements of all three systems.
Economic Theories, Data, and Graphs
Positive vs. Normative Statements
Positive Statements: Factual claims about what is, was, or will be.
Normative Statements: Value judgments about what ought to be.
Building and Testing Economic Theories
Theories are simplified representations of reality, consisting of variables, assumptions, and predictions. They are tested against data and revised or discarded if inconsistent with evidence.
Economic Models: Visual, graphical, verbal, or mathematical representations of theories.
Good Model Criteria: Clarity, predictive accuracy, communication, and usefulness.
Statistical Analysis in Economics
Correlation vs. Causation: Correlation does not imply causation; advanced statistical techniques are needed to establish causal relationships.
Endogeneity: Distinguishes between exogenous (determined outside the model) and endogenous (determined within the model) variables.
Economic Data and Index Numbers
Index Number: Measures a variable relative to a base period (base = 100).
Formula:

Graphing Economic Data
Cross-sectional Data: Observations at a single point in time across different subjects.
Time-series Data: Observations of a variable over time for a single subject.
Scatter Diagrams: Graphs showing the relationship between two variables.
What Macroeconomics Is All About
Key Macroeconomic Variables
National Income/Product: Total value of goods and services produced (GDP).
Nominal vs. Real GDP: Nominal is measured in current prices; real is measured in constant prices (base year).
Business Cycle: Fluctuations in real GDP over time (recession, trough, recovery, peak).
Potential Output (Y*): The level of output when all resources are fully employed.
Output Gap:
Employment and Unemployment
Labour Force: Employed + Unemployed (actively seeking work).
Unemployment Rate:
Types of Unemployment: Frictional, Structural, Cyclical, Seasonal.
Productivity and Growth
Productivity: Output per unit of input (e.g., labour productivity = real GDP / employment).
Public Goods: Non-rival and non-excludable (e.g., technological knowledge).
Inflation and Price Level
Price Level: Average level of prices in the economy (measured by CPI or GDP deflator).
Inflation: Rise in the price level; Deflation: fall in the price level.
Rate of Inflation Formula:
Interest Rates
Nominal Interest Rate: Stated rate, not adjusted for inflation.
Real Interest Rate: Nominal rate adjusted for inflation:
Exchange Rates and Trade Flows
Exchange Rate: Number of units of domestic currency needed to buy one unit of foreign currency.
Net Exports: Exports minus imports (trade balance).
The Measurement of National Income
Three Approaches to Measuring GDP
Value Added Approach: GDP is the sum of value added at each stage of production.
Expenditure Approach: GDP = C + I + G + (X - IM)
Income Approach: GDP = Factor incomes + Indirect taxes (net of subsidies) + Depreciation
Nominal vs. Real GDP and the GDP Deflator
Nominal GDP: Valued at current prices.
Real GDP: Valued at base-year prices.
GDP Deflator Formula:
Omissions from GDP
Illegal activities, underground economy, home production, volunteering, leisure, and externalities are not included in GDP.
GDP is an imperfect but useful measure of economic activity and living standards.
The Simplest Short-Run Macro Model
Desired Aggregate Expenditure (AE)
AE Formula:
Autonomous Expenditure: Does not depend on national income.
Induced Expenditure: Varies systematically with national income.
The Consumption Function
General Form:
Marginal Propensity to Consume (MPC):
Average Propensity to Consume (APC):
Saving Function:
MPC + MPS = 1 (where MPS is marginal propensity to save)
Equilibrium National Income
Equilibrium occurs when (aggregate expenditure equals national income).
If , inventories fall and output rises; if , inventories rise and output falls.
Solving for Equilibrium:
The Simple Multiplier
Multiplier Formula: , where is the marginal propensity to spend.
The multiplier shows how a change in autonomous expenditure leads to a larger change in equilibrium income.
