Back
BackFinance, Saving, and Investment: Principles of Macroeconomics Study Notes
Study Guide - Smart Notes
 Tailored notes based on your materials, expanded with key definitions, examples, and context.
Finance, Saving, and Investment
Introduction
This chapter explores the flow of funds in financial markets, the interaction of saving and investment, the role of financial institutions, and the impact of government policies on financial markets. Understanding these concepts is essential for analyzing how economies allocate resources over time and how financial decisions affect economic growth and stability.
Scarcity, Value, and Money
Scarcity and Value
Scarcity refers to the limited availability of resources relative to the wants and needs for them.
The value of goods, services, and money is determined by their relative scarcity.
Example: Diamonds are scarce and highly valued, while water is essential but often inexpensive due to its abundance.
The value of money is inversely related to the price level; as the supply of money increases, its value decreases, leading to inflation.
Inflation is a sustained increase in the price level, which reduces the real value of money over time.
Finance and Money
Finance
Concerns how households and firms acquire and use financial resources.
Involves managing risk through financial markets and activities.
Money
Used by households and firms as a medium of exchange, store of value, and unit of account.
Banks play a key role in creating and managing money, influencing the overall economy through the money supply.
Capital, Financial Capital, and Investment
Definitions and Relationships
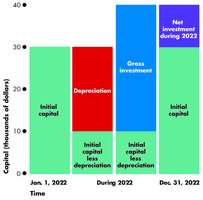
Capital: Tools, machines, buildings, and other items produced in the past and used to produce goods and services.
Financial capital: Financial resources used to purchase physical capital.
Gross investment: Total spending on new capital (including replacement of depreciated capital).
Depreciation: Reduction in the value of capital due to use, obsolescence, or wear and tear.
Net investment: The change in the capital stock, calculated as gross investment minus depreciation.
Wealth and Saving
Key Concepts
Income: Earnings received by individuals or households during a specific period.
Saving: Portion of income not spent on consumption or taxes; adds to wealth.
Wealth: The value of assets owned minus liabilities.
Net wealth = Wealth – Liabilities
Assets: Items of value owned, such as real estate, vehicles, stocks, bonds, art, and precious metals.
Capital gain: Increase in the value of an asset.
Capital loss: Decrease in the value of an asset.
Financial Capital Markets
Loan Markets
Businesses and individuals borrow from banks and other intermediaries.
Includes mortgages, car loans, business loans, and loans for capital purchases.
Bond Markets
Governments and large businesses issue bonds to borrow money.
Bond: A contract specifying interest payments and repayment of principal at maturity.
Term to maturity: Duration until the bond matures.
Coupon rate: Interest rate promised by the issuer.
Face value: Principal amount repaid at maturity.
Yield: Interest rate earned by the bondholder.
Mortgage-backed securities are bonds secured by home mortgages.
Higher risk leads to higher required interest rates.
Yield curves show the relationship between interest rates and term to maturity (typically upward sloping).
Stock Markets
Stocks represent ownership in a company.
Major exchanges include NYSE, NASDAQ, and London Stock Exchange.
IPO and treasury stock sales raise new capital for companies; trading existing shares does not.
Financial Institutions
Types and Roles
Commercial banks: Accept deposits and make loans to households and firms.
Government-sponsored mortgage lenders: Fannie Mae and Freddie Mac buy mortgages, create mortgage-backed securities, and sell them to investors.
Mutual funds: Pool individual savings to invest in diversified portfolios.
Pension funds: Invest employee and employer contributions in financial assets for retirement.
Insurance companies: Collect premiums, invest funds, and pay claims for insured events.
Sources of Investment Funds
Investment Funding
Comes from household saving, government budget surplus, and borrowing from abroad.
GDP relationships:
Equating and rearranging:
Financial Decisions and Risks
Time Value of Money
Households and firms compare the value of money today with its value in the future.
Present value (PV) of a future amount is calculated as: where is the interest rate and is the number of periods.
Bond pricing example: For a bond with P_{bond} = \frac{5,000}{1 + 0.05} + \frac{105,000}{(1 + 0.05)^2} = 4,761.90 + 95,238.10 = 100,000$
If market rate rises to 7.5%, bond price falls:
Net Present Value (NPV):
If NPV is positive, the investment is profitable; if negative, it is not.
Higher risk requires a higher discount rate.
Example: Capital Equipment Purchase
Purchase price: $750,000; annual revenue: $100,000 for 5 years; resale value: $400,000; discount rate: 7%.
Present value of benefits:
Net cost after resale:
NPV: (not profitable)
Insolvency and Illiquidity
Net worth = Market value of assets – Market value of liabilities
If net worth > 0, the business is solvent; if < 0, insolvent.
Illiquidity: Inability to sell assets quickly to meet cash demands.
Interest Rates
Interest rate = Interest payment / Asset price
Interest rates and asset prices are determined simultaneously.
Real interest rate = Nominal interest rate – Inflation rate
Example: If nominal rate is 3.49% and inflation is 2.7%, real rate is 0.79%.
Loanable Funds Market
Market Overview
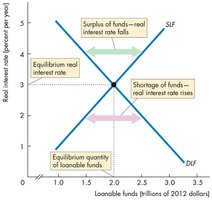
Aggregates all financial markets to determine the real interest rate, quantity of funds loaned, saving, and investment.
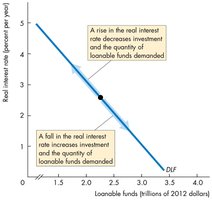
Demand for loanable funds depends on the real interest rate and expected profit.
Demand for Loanable Funds
Inverse relationship between real interest rate and quantity demanded.
More investment opportunities exist at lower real interest rates.
Demand curve slopes downward.
Supply of Loanable Funds
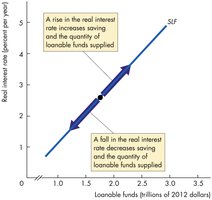
Sum of private and government saving.
Positive relationship between real interest rate and quantity supplied.
Supply curve shifts with changes in disposable income, expected future income, wealth, and default risk.
Equilibrium in the Loanable Funds Market
Occurs where quantity demanded equals quantity supplied.
Changes in supply or demand cause volatility in real interest rates and asset prices.
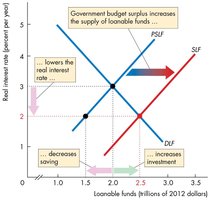
Government Budget Surplus
Increases supply of loanable funds, lowering the real interest rate.
Increases equilibrium investment and decreases private saving.
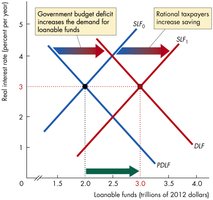
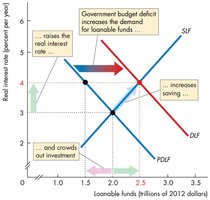
Government Budget Deficit
Increases demand for loanable funds, raising the real interest rate.
Decreases equilibrium private investment (crowding out effect).
Increase in private saving can partially offset crowding out.
Ricardo-Barro Effect
Rational taxpayers anticipate future tax increases due to deficits and increase saving today.
This can increase the supply of loanable funds and offset the impact of deficits on real interest rates.
In practice, the effect is partial and does not fully neutralize the impact of deficits.