 Back
BackInflation, Unemployment, and Federal Reserve Policy: The Phillips Curve and Modern Central Banking
Study Guide - Smart Notes
 Tailored notes based on your materials, expanded with key definitions, examples, and context.
Inflation, Unemployment, and Federal Reserve Policy
Introduction
This chapter explores the relationship between inflation and unemployment, focusing on the Phillips curve, the evolution of monetary policy, and the role of expectations. It also examines the development of Federal Reserve policy and compares central banking practices internationally.
The Short-Run Trade-Off between Unemployment and Inflation
The Phillips Curve
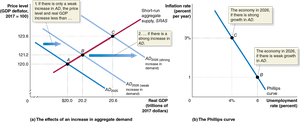
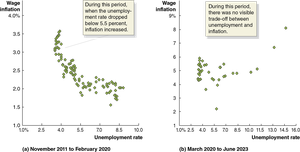
The Phillips curve illustrates the short-run inverse relationship between the unemployment rate and the inflation rate. In the short run, lower unemployment is associated with higher inflation, and vice versa. This relationship was first identified by economist A.W. Phillips.
Key Point: The Phillips curve is downward sloping in the short run, indicating a trade-off between inflation and unemployment.
Key Point: Policymakers once believed they could choose a combination of inflation and unemployment along this curve.
Example: In the 1960s, the U.S. experienced low unemployment and rising inflation, consistent with the Phillips curve.
Is the Phillips Curve a Policy Menu?
Initially, economists thought the Phillips curve represented a stable, structural relationship. However, it became clear that allowing more inflation does not lead to permanently lower unemployment. In the long run, the trade-off disappears.
The Long-Run Phillips Curve
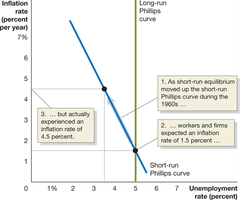
By the late 1960s, economists such as Milton Friedman and Edmund Phelps argued that the long-run Phillips curve is vertical. In the long run, unemployment returns to its natural rate, determined by structural and frictional factors, not by inflation.
Key Point: The long-run Phillips curve is vertical at the natural rate of unemployment.
Key Point: There is no permanent trade-off between inflation and unemployment.


The Role of Expectations
The short-run trade-off exists because workers and firms sometimes misjudge future inflation. If inflation is higher or lower than expected, real wages change, affecting hiring decisions. Milton Friedman emphasized that only unanticipated inflation creates a temporary trade-off.
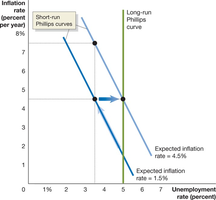
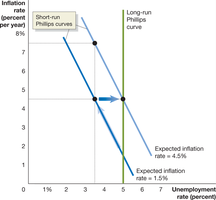
Key Point: Expectations of inflation shift the short-run Phillips curve.
Example: If workers expect 3% inflation but actual inflation is 5%, real wages fall, and firms hire more workers temporarily.
The Short-Run and Long-Run Phillips Curves
Relationship between Short-Run and Long-Run Phillips Curves
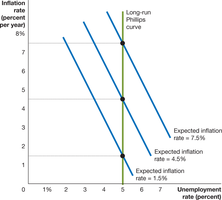
Each expected inflation rate generates a different short-run Phillips curve. When actual inflation matches expectations, unemployment is at its natural rate. If inflation is higher than expected, unemployment temporarily falls below the natural rate, but this effect disappears as expectations adjust.
Key Point: The economy moves along the short-run Phillips curve when inflation surprises workers and firms.
Key Point: As expectations adjust, the short-run Phillips curve shifts, and the economy returns to the long-run Phillips curve.
The Natural Rate of Unemployment (NAIRU)
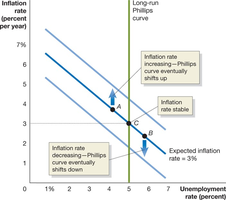
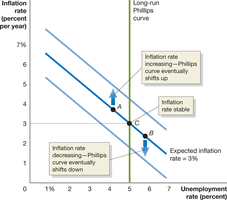
The natural rate of unemployment is sometimes called the nonaccelerating inflation rate of unemployment (NAIRU). If unemployment is below the natural rate, inflation accelerates; if above, inflation decelerates.
Does the Natural Rate of Unemployment Change?
Demographic changes: Younger, less skilled workers increase the natural rate.
Labor market institutions: Changes in unemployment insurance, unionization, or firing laws affect the natural rate.
Long-term unemployment: Extended unemployment can erode skills, raising the natural rate.
Monetary Policy and Expectations of the Inflation Rate
Expectations and Monetary Policy
How quickly the economy returns to the long-run Phillips curve depends on how fast expectations adjust. The speed of adjustment depends on the inflation environment:
Low inflation: Slow adjustment; inflation is often ignored.
Moderate, stable inflation: Quick adjustment; expectations adapt easily.
High, unstable inflation: Quick adjustment; rational expectations become important.
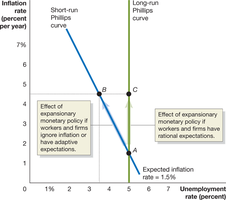
Rational expectations are formed using all available information, not just past inflation rates.
Is the Short-Run Phillips Curve Really Vertical?
Some economists, such as Robert Lucas and Thomas Sargent, argued that if workers and firms have rational expectations, the short-run Phillips curve could be vertical. Critics argue that expectations are not always rational and that wages and prices do not adjust instantly.
Real Business Cycle Models
Real business cycle models attribute fluctuations in real GDP to real (not monetary) shocks, such as changes in technology. These models assume rational expectations and flexible prices, and are part of the new classical macroeconomics.
The Development of Federal Reserve Policy and Foreign Central Banks
U.S. Federal Reserve Policy since the 1970s
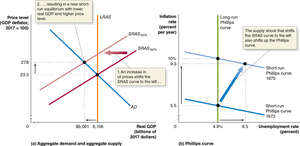
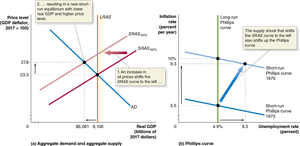
In the 1970s, the Fed's policies contributed to high inflation, exacerbated by supply shocks such as the OPEC oil crisis. The Fed responded with expansionary policy, which reduced unemployment but increased inflation further.
The Volcker Disinflation
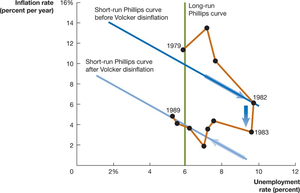
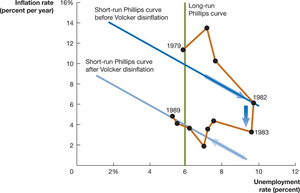
In the late 1970s and early 1980s, Fed Chair Paul Volcker implemented contractionary monetary policy to reduce inflation. It took several years for expectations to adjust and for inflation to fall, demonstrating the importance of credibility in monetary policy.
Fed Credibility and Transparency
Since the 1990s, the Fed has increased transparency by announcing policy changes and publishing meeting minutes.
Greater credibility has helped anchor inflation expectations and reduce the cost of disinflation.
Alternative Measures of Labor Market Health
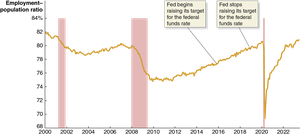
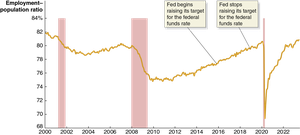
Some economists argue that the employment–population ratio for prime-aged workers is a better measure of labor market health than the unemployment rate.
Recent Changes in Fed Policy
After the Great Inflation, the Fed focused on preemptively fighting inflation. In 2020, the Fed shifted to waiting until inflation exceeded its target before tightening policy. This led to high inflation in 2021–2022, prompting a rapid increase in interest rates.
Has the Phillips Curve Disappeared?
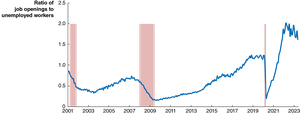
Recent data show periods where the Phillips curve relationship is weak or absent, especially during the COVID-19 pandemic. Alternative measures, such as the ratio of job openings to unemployed workers or wage inflation, may better capture labor market dynamics.
Central Bank Independence and International Comparisons
Should the Fed Be Independent?
Arguments against independence: Democratic accountability, easier coordination with fiscal policy.
Arguments for independence: Avoids political business cycles, prevents excessive inflation, and maintains credibility.
Empirical evidence shows that more independent central banks tend to have lower inflation rates.
Central Banking in Other Countries
Bank of England: Gained independence in 1997; government can overrule in extreme cases.
Bank of Japan: High autonomy since 1998; practiced yield curve control from 2016–2023.
Bank of Canada: Inflation target set jointly with government, but high de facto independence.
European Central Bank (ECB): Highly independent, sets policy for the euro zone; faces challenges due to diverse member economies.
Inflation across Countries in the Covid-19 Era
During the COVID-19 period, inflation rose in most high-income countries, peaking in mid-2022 before declining. Japan was an exception, with a peak inflation rate below 5%.
Country | Central Bank Independence | Inflation Trend (2021–2023) |
|---|---|---|
United States (Fed) | High | Inflation rose, then declined after policy tightening |
United Kingdom (Bank of England) | High | Similar pattern to U.S. |
Japan (Bank of Japan) | High | Low inflation, unique yield curve control policy |
Canada (Bank of Canada) | High | Similar pattern to U.S. |
Eurozone (ECB) | High | Inflation rose, then declined; recession risk higher |
Additional info: The Phillips curve remains a useful but imperfect tool for understanding short-run macroeconomic dynamics. Central bank credibility, expectations, and institutional independence are crucial for effective monetary policy.
