 Back
BackInternational Trade, Tariffs, and Comparative Advantage: Study Notes for Macroeconomics
Study Guide - Smart Notes
 Tailored notes based on your materials, expanded with key definitions, examples, and context.
International Trade and Tariffs
Introduction to International Trade
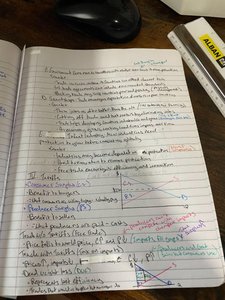
International trade allows countries to exchange goods and services, increasing overall economic welfare. By specializing in the production of goods for which they have a comparative advantage, countries can consume beyond their production possibilities frontiers (PPFs).
Absolute Advantage: The ability of a country to produce more of a good with the same resources than another country.
Comparative Advantage: The ability of a country to produce a good at a lower opportunity cost than another country.
Terms of Trade: The rate at which one good is exchanged for another between countries.
Gains from Trade: Both countries can benefit if they specialize according to comparative advantage and trade at mutually beneficial terms.
Example: If the U.S. can produce wheat more efficiently and France can produce cheese more efficiently, both benefit by specializing and trading.
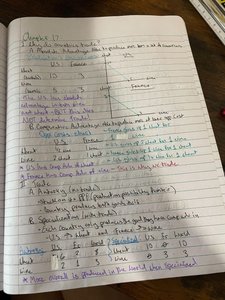
Production Possibilities Frontier (PPF) and Specialization
The PPF illustrates the maximum possible output combinations of two goods that an economy can achieve given its resources and technology. Specialization and trade allow countries to consume outside their PPFs.
When countries specialize, total world production increases.
Opportunity cost determines comparative advantage.
Example Table:
Country | Wheat (units) | Cheese (units) |
|---|---|---|
U.S. | 15 | 5 |
France | 10 | 10 |
Here, the U.S. has an absolute advantage in wheat, France in cheese. Opportunity cost calculations determine comparative advantage.
Tariffs and Their Effects
A tariff is a tax on imported goods. Tariffs raise the domestic price of the imported good, benefiting domestic producers but harming consumers and causing deadweight loss.
Consumer Surplus: Decreases due to higher prices.
Producer Surplus: Increases as domestic producers sell more at higher prices.
Government Revenue: Increases by the amount of the tariff times the quantity imported.
Deadweight Loss: Represents the net welfare loss to society due to inefficient production and reduced consumption.
Example: If the world price of a good is $1 and a tariff raises it to $2, domestic quantity supplied increases, imports decrease, and total welfare falls.
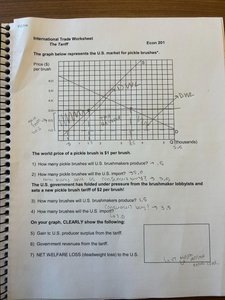
Graphical Analysis of Tariffs
Supply and demand diagrams are used to illustrate the effects of tariffs. The area between the supply and demand curves, before and after the tariff, shows changes in consumer and producer surplus, government revenue, and deadweight loss.
Identify equilibrium price and quantity without trade, with free trade, and with a tariff.
Mark areas representing surpluses and losses.
Arguments for and Against Tariffs
Common arguments for tariffs include protecting domestic jobs, national security, and infant industries. However, most economists agree that tariffs reduce overall welfare.
National Security: Some industries are vital for defense and should be protected.
Infant Industry: New industries may need temporary protection to develop.
Retaliation: Other countries may impose tariffs in response, leading to trade wars.
Economic Efficiency: Tariffs distort market outcomes and reduce total surplus.
Comparative Advantage and Specialization
Opportunity Cost and Specialization
Comparative advantage is determined by comparing opportunity costs. The country with the lower opportunity cost for a good should specialize in its production.
Calculate opportunity cost for each good in each country.
Specialization increases total output and allows for beneficial trade.
Example Table:
Country | Good | Opportunity Cost |
|---|---|---|
U.S. | Wheat | 1/3 Cheese |
France | Wheat | 1 Cheese |
Here, the U.S. has a comparative advantage in wheat, France in cheese.
Terms of Trade
The terms of trade must fall between the opportunity costs of the two countries for both to benefit from trade.
If the U.S. trades 1 wheat for 0.5 cheese, both countries gain compared to autarky.
Summary Table: Effects of Tariffs
Effect | Without Tariff | With Tariff |
|---|---|---|
Domestic Price | World Price | World Price + Tariff |
Consumer Surplus | High | Lower |
Producer Surplus | Low | Higher |
Government Revenue | 0 | Tariff x Imports |
Deadweight Loss | 0 | Present |
Key Formulas
Opportunity Cost:
Tariff Revenue:
Deadweight Loss: Area of triangles representing lost surplus due to reduced consumption and inefficient production.
Conclusion
International trade and tariffs are central topics in macroeconomics. Understanding comparative advantage, the effects of tariffs, and the graphical analysis of trade policies is essential for analyzing real-world economic issues. While tariffs can protect certain groups, they generally reduce overall economic welfare by creating deadweight losses and distorting market outcomes.
