 Back
BackInvestment, Consumption-Savings Decision, Fiscal Policy, and Goods Market Equilibrium in Macroeconomics
Study Guide - Smart Notes
 Tailored notes based on your materials, expanded with key definitions, examples, and context.
Investment
The Role of Investment
Investment refers to spending on physical capital goods, such as machinery, buildings, and infrastructure. It is distinct from financial investment (e.g., stocks and bonds), which constitutes savings. Investment is a key driver of economic growth and accounts for about 20% of GDP on average, but it fluctuates sharply over the business cycle and contributes significantly to GDP declines during recessions.
Physical capital investment increases the productive capacity of the economy.
Investment volatility is a major source of business cycle fluctuations.
The Desired Capital Stock: Basic Model
Firms choose the level of capital that maximizes their profits by comparing the marginal benefit and marginal cost of additional capital.
Marginal benefit: The expected future marginal product of capital (MPKf).
Marginal cost: The user cost of capital (uc), which includes the real interest rate, depreciation, and the price of capital goods.
The user cost of capital is given by:
r: Expected real interest rate
d: Depreciation rate
pK: Real price of capital goods
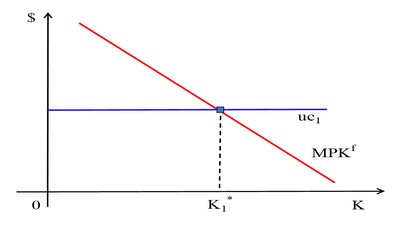
Determining the Desired Capital Stock
The desired capital stock (K*) is where the marginal product of capital equals the user cost:
The MPKf curve slopes downward due to diminishing returns.
The uc curve is horizontal for a given r.
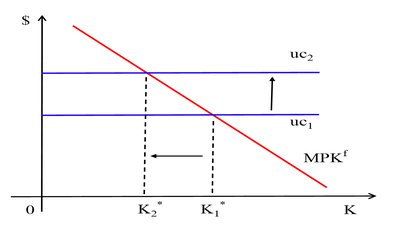
Effect of Changes in the User Cost of Capital
If the real interest rate (r), depreciation (d), or price of capital goods (pK) rises, the user cost increases, reducing the desired capital stock. Improvements in technology shift the MPKf curve up, increasing the desired capital stock.
Taxes and the Desired Capital Stock
Taxes affect the after-tax return on capital. If ω is the effective tax rate, the after-tax return is (1–ω)MPKf. The desired capital stock is chosen so that:
or
An increase in ω raises the tax-adjusted user cost and reduces K*.
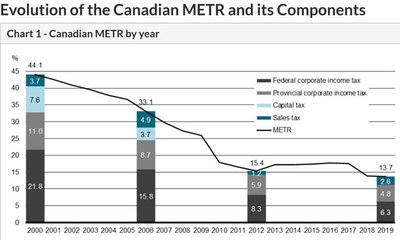
The marginal effective tax rate (METR) reflects all tax components affecting investment.
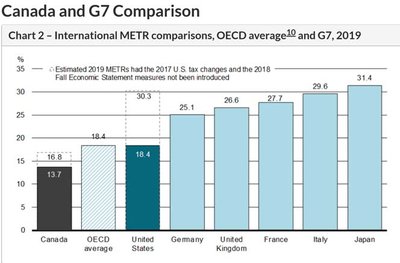
Marginal Effective Tax Rate (METR) in Canada
Canada's METR has declined significantly since 2000 and is now low relative to other G7 countries.
Investment Dynamics
Gross investment (It) is the total purchase of new capital goods. Net investment is the change in the capital stock:
Desired investment is:
Desired investment decreases with higher r, d, ω, and pK.
Consumption-Savings Decision
Key Concepts
Desired consumption (Cd): Aggregate quantity of goods and services households want to consume.
Desired saving (Sd): Level of national saving when aggregate consumption is at its desired level.
Consumption-smoothing motive: Households prefer a stable consumption pattern over time.
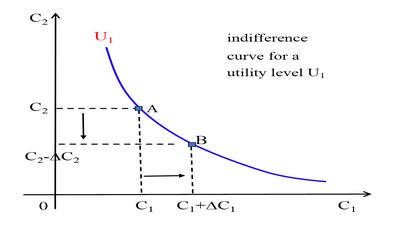
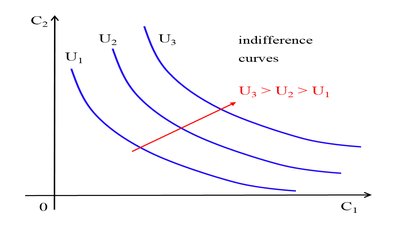
Two-Period Model
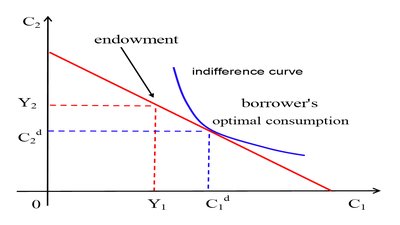
Households choose consumption in two periods (today and the future) to maximize utility, subject to their budget constraint. Indifference curves represent combinations of current and future consumption yielding the same utility.
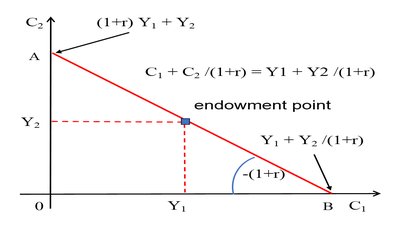
Budget Constraints
Today:
Future:
Intertemporal:
Here, W (wealth) is defined as:
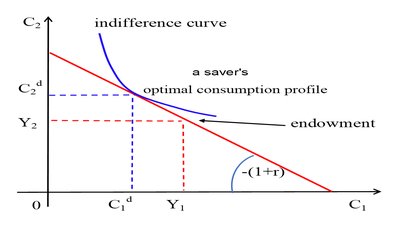
Optimal Consumption Choices
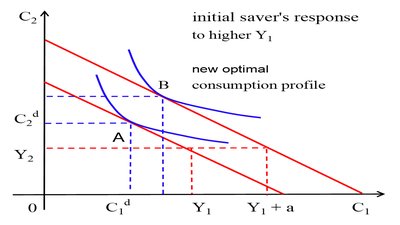
Savers choose a point where current consumption is less than current income, lending the difference.
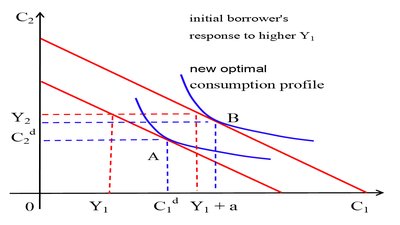
Borrowers choose a point where current consumption exceeds current income, borrowing against future income.
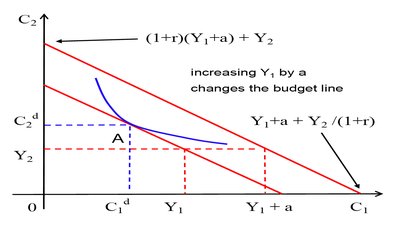
Effects of Changes in Income
An increase in current income shifts the budget constraint outward, increasing consumption in both periods (if consumption is a normal good).
Marginal Propensity to Consume (MPC)
The MPC is the fraction of additional current income that is consumed in the current period:
Typically, MPC < 1, as some of the income is saved.
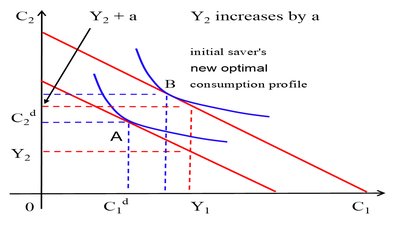
Effects of Changes in Future Income
An increase in future income raises current consumption (due to consumption smoothing) and reduces current saving.
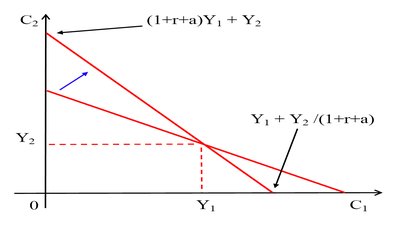
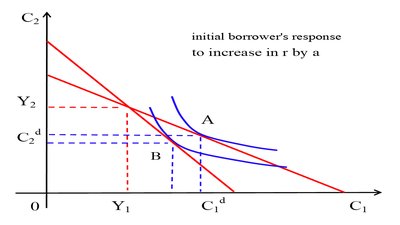
Effects of Changes in the Real Interest Rate
An increase in r rotates the budget constraint, making future consumption relatively cheaper.
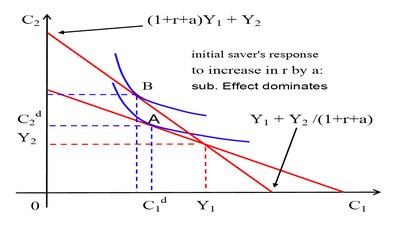
The substitution effect: higher r reduces current consumption and increases saving.
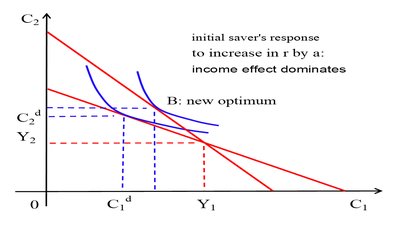
The income effect: depends on whether the household is a saver or borrower.
Fiscal Policy
Government Budget Constraint
Government saving:
Government intertemporal constraint:
Household Budget Constraint with Taxes
After-tax constraint:
Effects of Government Purchases
Increase in G1 financed by taxes: reduces current disposable income, lowering Cd1 and Sdp.
Increase in G1 financed by borrowing: reduces future disposable income, lowering Cd1 and raising Sdp.
In both cases, desired national saving declines.
Ricardian Equivalence
Ricardian equivalence suggests that the timing of taxes does not affect the present value of disposable income, so a tax cut today (without reduced spending) does not increase consumption, as households anticipate higher future taxes.
In practice, Ricardian equivalence may not hold due to credit constraints, distortionary taxes, or different borrowing rates for government and households.
Goods Market Equilibrium
Equilibrium Condition
In a closed economy, goods market equilibrium occurs when output equals the sum of desired consumption, investment, and government spending:
Alternatively, desired investment equals desired saving:
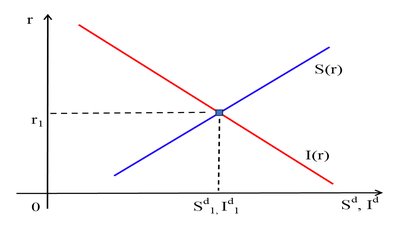
Savings-Investment Curves
The saving curve S(r) is upward sloping: higher r increases desired saving.
The investment curve I(r) is downward sloping: higher r increases user cost and reduces investment.
The real interest rate adjusts to bring the market into equilibrium.
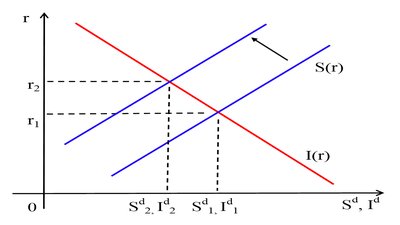
Shifts in Saving and Investment Curves
Savings curve shifts left (up) if Y1 decreases, Y2 increases, or G increases (crowding out investment).
Investment curve shifts right (up) if d, ω, or pK decrease, or expected TFP increases.
Current Low Real Interest Rates in Canada
Low real interest rates may result from an outward shift in the saving curve, an inward shift in the investment curve, or both. In an open economy, the real interest rate is determined in global markets.
