 Back
BackLong-Run and Short-Run Concerns: Growth, Productivity, Unemployment, and Inflation
Study Guide - Smart Notes
 Tailored notes based on your materials, expanded with key definitions, examples, and context.
Growth, Productivity, Unemployment, and Inflation
Overview of Macroeconomic Concerns
This chapter addresses the fundamental macroeconomic issues of economic growth, productivity, unemployment, and inflation. Understanding these concepts is essential for analyzing the health and performance of an economy over both the short and long run.
Long-Run Output and Productivity
Growth and Productivity
Economic growth refers to the increase in a country’s output of goods and services over time, typically measured by real GDP. Productivity, especially labor productivity, is a key determinant of growth and reflects the efficiency with which inputs are converted into outputs.
Output Growth: The growth rate of the total output of the economy.
Per-Capita Output Growth: The growth rate of output per person, indicating improvements in living standards.
Productivity Growth: The growth rate of output per worker, driven by factors such as physical capital, human capital, natural resources, technological knowledge, and entrepreneurship.
Factors of Production: Inputs used to produce goods and services, including physical capital, human capital, natural resources, technological knowledge, and entrepreneurship.
Example: If real GDP per person grows at 2% per year, the standard of living doubles approximately every 35 years.
Recessions, Depressions, and Unemployment
Defining and Measuring Unemployment
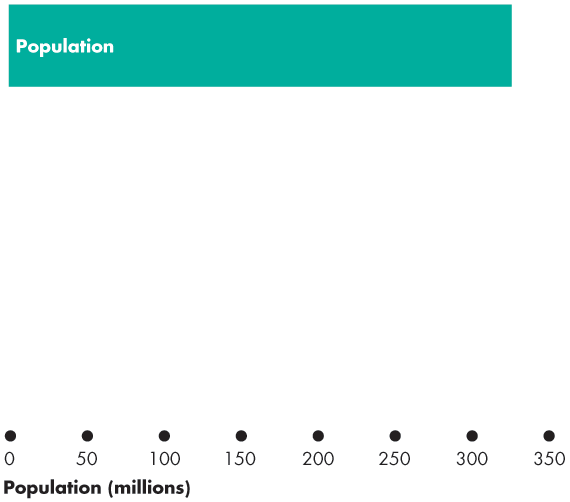
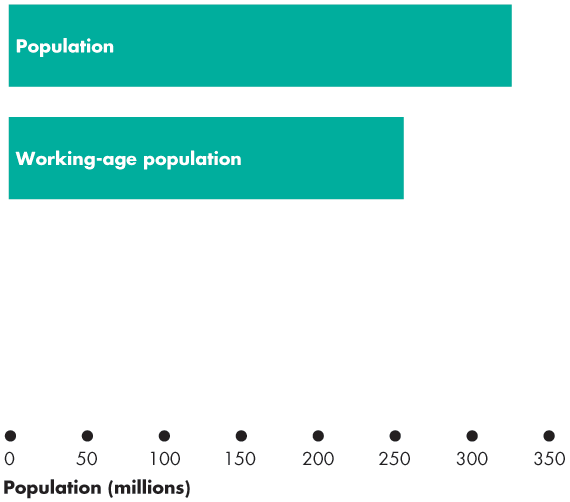
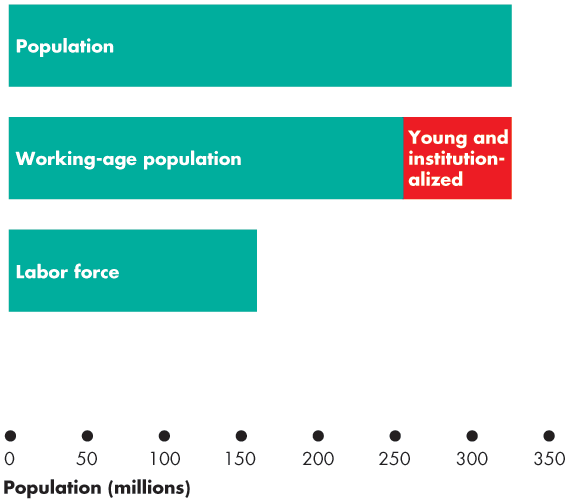
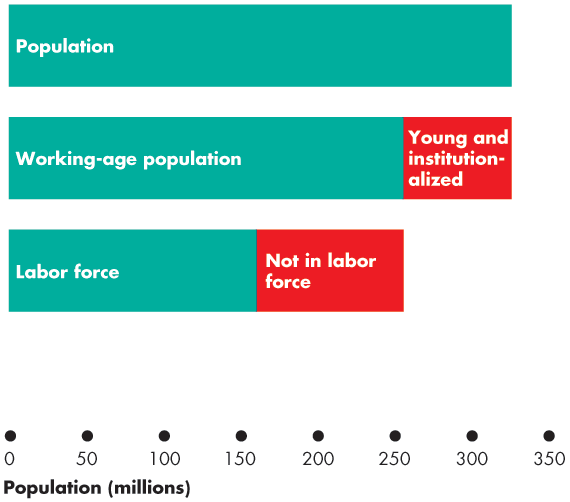
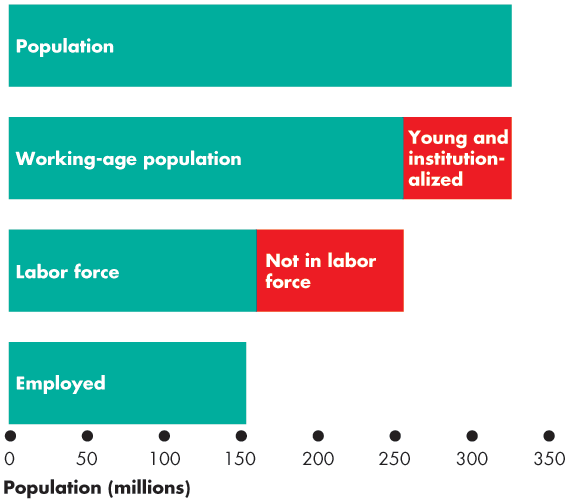
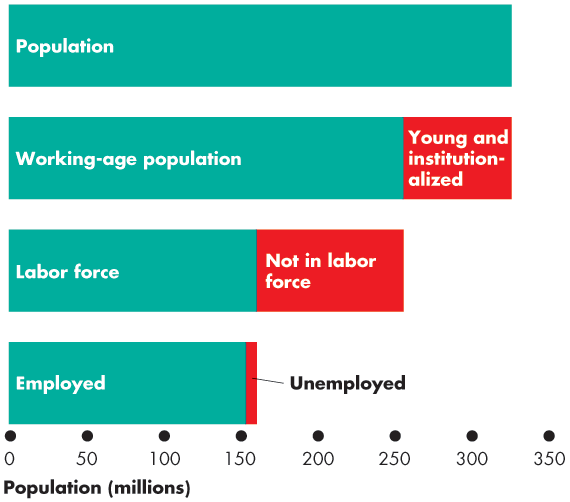
Unemployment is a key indicator of economic health. It is measured as the percentage of the labor force that is not employed but actively seeking work. The labor force includes all working-age individuals who are either employed or actively seeking employment.
Unemployment Rate Formula:
Labor Force Participation Rate: The percentage of the working-age population in the labor force.
Employment-to-Population Ratio: The percentage of working-age people who have jobs.
Example: In January 2019, the unemployment rate was 4 percent, and the labor force participation rate was 63.2 percent.
Components and Types of Unemployment
Unemployment can be categorized into four types, each with distinct causes and implications:
Frictional Unemployment: Short-term unemployment arising from the process of matching workers with jobs.
Structural Unemployment: Unemployment caused by changes in the structure of the economy, such as technological advances or shifts in consumer demand.
Seasonal Unemployment: Unemployment due to seasonal variations in demand for labor.
Cyclical Unemployment: Unemployment resulting from economic downturns or recessions.
Full Employment: Occurs when there is no cyclical unemployment, and all unemployment is frictional, structural, or seasonal. The natural unemployment rate is the rate when the economy is at full employment.
Inflation
Defining Inflation and Price Indexes
Inflation is the sustained increase in the general price level of goods and services in an economy. It is measured using various price indexes:
Consumer Price Index (CPI): Measures the average prices paid by urban consumers for a fixed market basket of goods and services.
Personal Consumption Expenditures (PCE) Deflator: Measures the average prices paid by urban consumers for a changing market basket of goods and services.
GDP Deflator: An average of current prices of all goods and services included in GDP, expressed as a percentage of base-year prices.
Inflation Rate Formula:
Deflation: Occurs when the inflation rate is negative, indicating a decrease in the general price level.
Sources of Bias in the CPI
The CPI may overestimate inflation due to several biases:
New Goods Bias: The introduction of new products is not immediately reflected in the CPI.
Quality Change Bias: Improvements in product quality are not fully accounted for.
Commodity Substitution Bias: Consumers may substitute cheaper goods, but the CPI basket remains fixed.
Outlet Substitution Bias: Changes in where consumers shop (e.g., discount stores) are not reflected.
Example: The CPI is used to adjust government outlays such as Social Security, food stamps, and pensions.
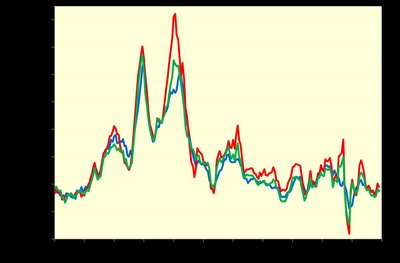
Labor Market Indicators
Key Labor Market Indicators
Three main indicators are used to assess labor market conditions:
Unemployment Rate: Percentage of the labor force that is unemployed.
Labor Force Participation Rate: Percentage of the working-age population in the labor force.
Employment-to-Population Ratio: Percentage of working-age people who are employed.

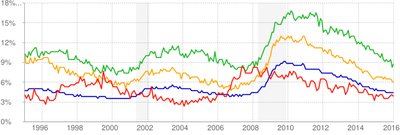
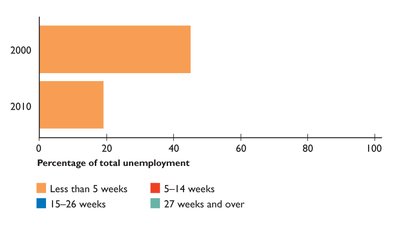
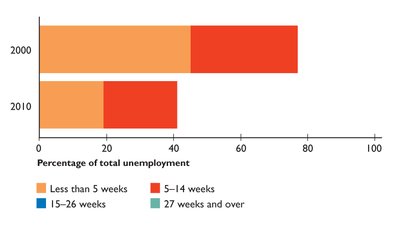
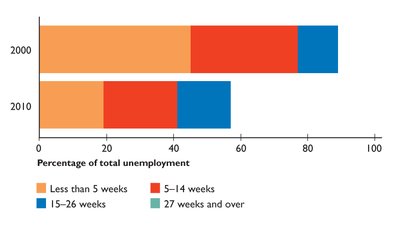
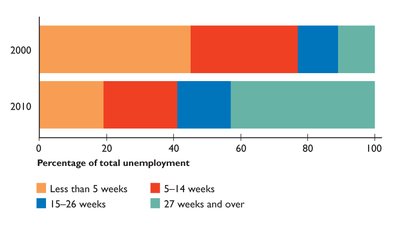
Unemployment Duration
The duration of unemployment varies with the business cycle. Long-term unemployment is rare during economic peaks but increases during troughs.
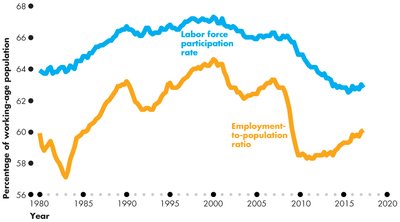
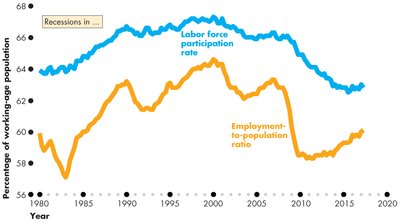
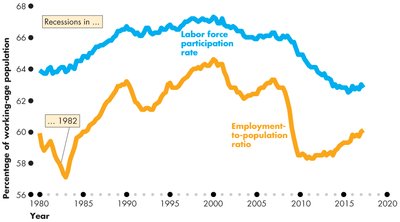
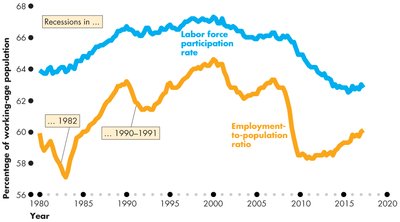
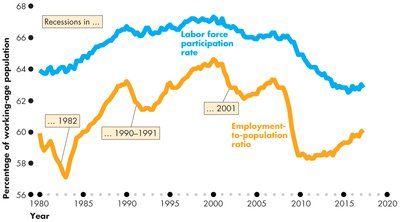
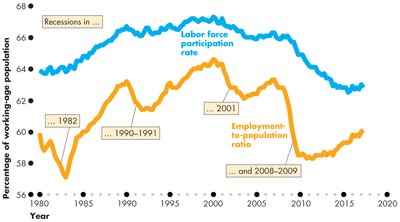
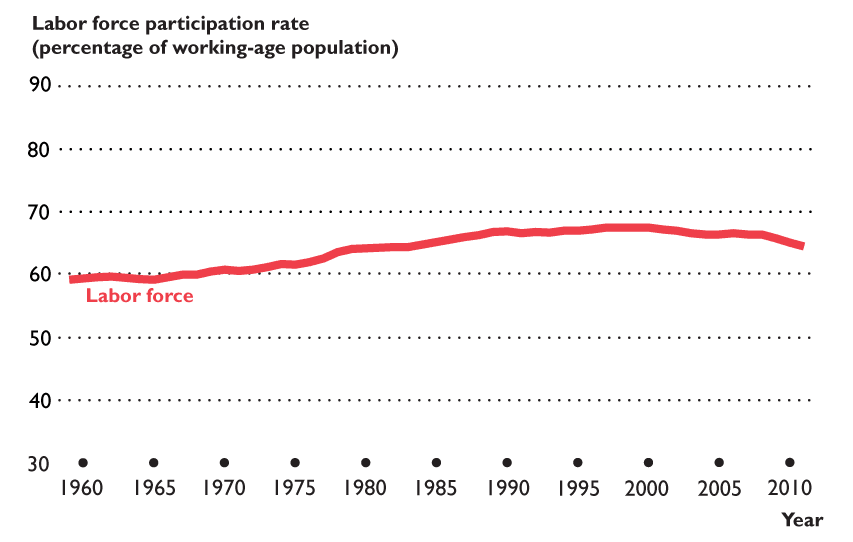
Trends in Labor Force Participation and Employment
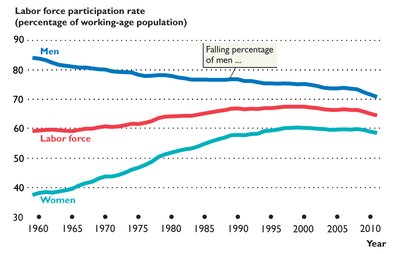
Labor force participation and employment-to-population ratios have shown long-term trends, rising before 2000 and declining afterward. These trends are influenced by demographic changes, economic conditions, and social factors.
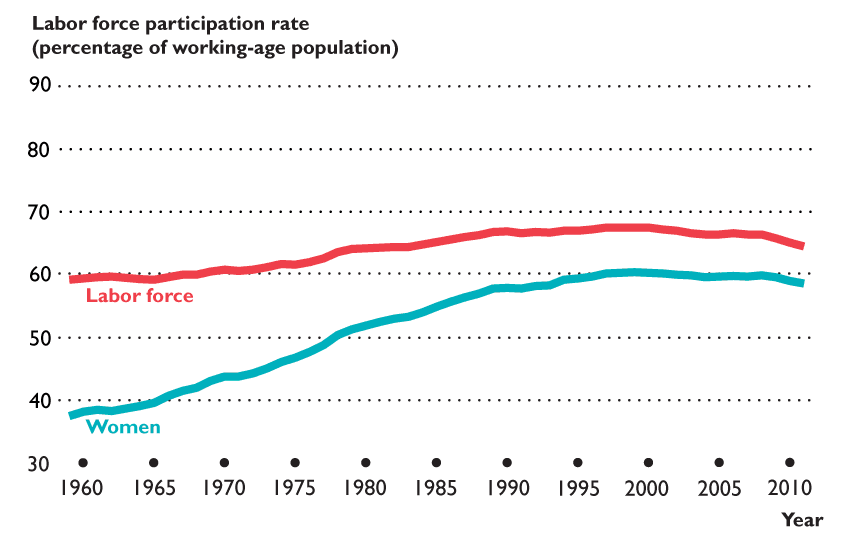
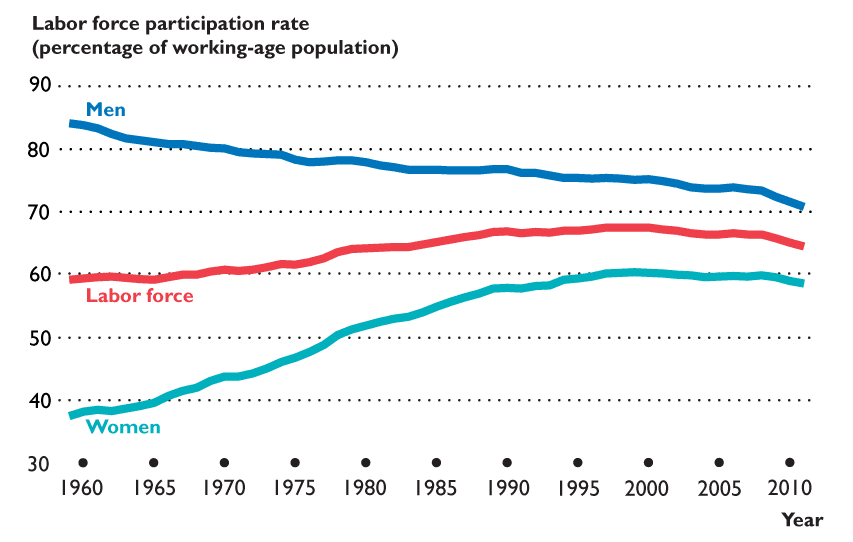
Demographic Trends in Labor Force Participation
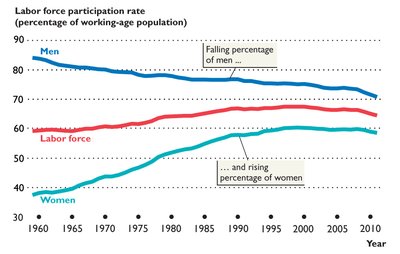
Labor force participation rates differ by gender and have changed over time. The participation rate for women has increased significantly, while the rate for men has declined.
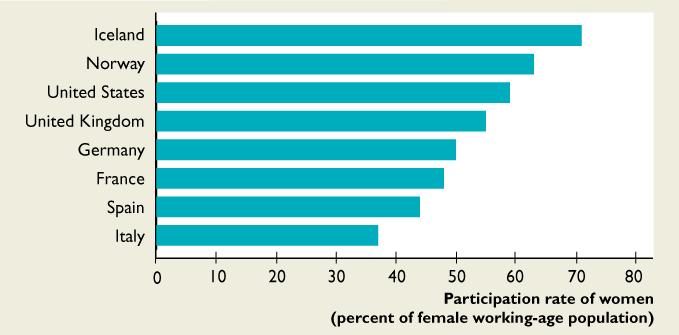
International Comparison of Female Labor Force Participation
Female labor force participation rates vary across countries, reflecting differences in social norms, economic structures, and policy environments.
Other Labor Market Trends
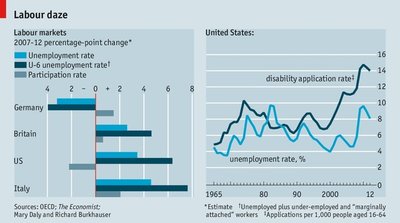
Rising disability claims and discouraged-worker effects can impact labor force statistics. The discouraged-worker effect occurs when individuals stop seeking work due to poor job prospects, reducing the measured unemployment rate.
Economic Growth Measurement
Calculating Growth Rates
Growth rates of real GDP are calculated to assess economic performance over time.
Growth Rate Formula:
Doubling Time: The number of years required for a variable to double, given its growth rate.
Example: If real GDP grows at 2% per year, it will double in approximately 35 years.
Summary Table: Types of Unemployment
Type | Description | Example |
|---|---|---|
Frictional | Short-term, between jobs | Recent graduate seeking first job |
Structural | Mismatch of skills and jobs | Factory worker displaced by automation |
Seasonal | Due to seasonal demand | Farm worker during off-season |
Cyclical | Due to economic downturns | Retail worker laid off during recession |
Conclusion
Understanding growth, productivity, unemployment, and inflation is central to macroeconomic analysis. These concepts provide insight into the performance and challenges of modern economies, guiding policy decisions and shaping societal outcomes.
