 Back
BackMacroeconomic Principles Final Exam Study Guidance
Study Guide - Smart Notes
 Tailored notes based on your materials, expanded with key definitions, examples, and context.
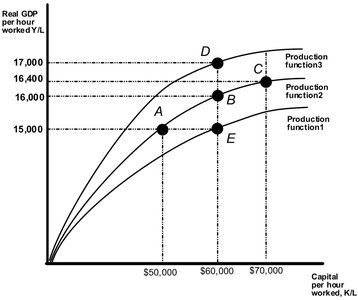
Q10. Positive technological change is shown in the above diagram by the movement from:
Background
Topic: Economic Growth and Production Functions
This question tests your understanding of how technological improvements affect the per-worker production function and real GDP per hour worked.
Key Terms and Formulas
Production Function: Shows the relationship between capital per hour worked (K/L) and real GDP per hour worked (Y/L).
Technological Change: Refers to improvements in technology that shift the production function upward, allowing more output for the same input.
Step-by-Step Guidance
Examine the graph: It shows three production functions (1, 2, 3) and points A, B, C, D, E representing different combinations of capital per hour worked and real GDP per hour worked.
Recall that positive technological change shifts the production function upward, meaning for the same capital per hour worked, output per hour worked increases.
Identify which movement on the graph represents an upward shift to a higher production function, holding capital per hour worked constant.
Compare the points: Look for a movement from a lower curve to a higher curve at the same K/L value.
Try solving on your own before revealing the answer!
Final Answer: B to D
Moving from point B to point D shows an upward shift in the production function at the same capital per hour worked, which is the effect of positive technological change.
This is because D is on a higher production function than B, but both have the same K/L value.
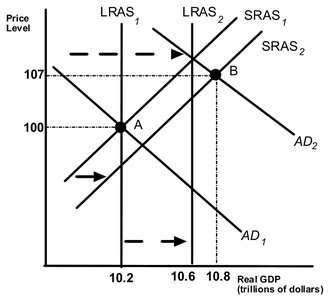
Q22. Given that the economy has moved from A to B in the graph above, which of the following would be the appropriate discretionary fiscal policy?
Background
Topic: Aggregate Supply and Demand, Fiscal Policy
This question tests your ability to interpret shifts in the AS-AD model and recommend fiscal policy actions based on the economy's position relative to potential GDP.
Key Terms and Formulas
Discretionary Fiscal Policy: Government actions (like changing spending or taxes) to influence economic activity.
Aggregate Demand (AD): Total demand for goods and services in the economy.
Aggregate Supply (AS): Total supply of goods and services.
Potential GDP: The level of GDP when the economy is at full employment.
Step-by-Step Guidance
Analyze the graph: The economy moves from point A to point B, which shows an increase in real GDP and price level.
Determine whether the economy is above or below potential GDP at point B. If above, inflationary pressures may exist; if below, recessionary pressures may exist.
Recall that appropriate discretionary fiscal policy depends on whether the economy needs to be stimulated or cooled down.
Consider the options: Increasing government spending or decreasing taxes stimulates the economy; increasing taxes or decreasing spending cools it down.
Try solving on your own before revealing the answer!
Final Answer: Increase government spending
Moving from A to B suggests the economy may be below potential GDP, so increasing government spending is an appropriate discretionary fiscal policy to boost aggregate demand.
This helps move real GDP closer to potential GDP.
