 Back
BackMacroeconomics for Business Decision: A World Tour of Key Issues
Study Guide - Smart Notes
 Tailored notes based on your materials, expanded with key definitions, examples, and context.
A Tour of the World
Introduction to Macroeconomics
Macroeconomics examines the performance, structure, and behavior of entire economies. This chapter provides a global perspective on major macroeconomic issues affecting countries today, including growth, crises, inequality, and environmental challenges.
Definition: Macroeconomics studies aggregate economic phenomena such as GDP, inflation, unemployment, and policy responses.
Key Issues: Economic growth, recessions, inflation, public debt, inequality, and climate change.
Application: Understanding macroeconomic trends helps inform business and policy decisions.
World Tour: The COVID-19 Global Pandemic
Macroeconomic Effects of COVID-19
The COVID-19 pandemic caused unprecedented disruptions to global economies, affecting output, employment, inflation, and public debt.
Output Collapse: Lockdowns led to sharp declines in GDP (U.S. GDP fell by 10%, Euro area by 14%).
Inflation: Initially decreased, then surged to 9.9% in the U.S. by mid-2022.
Unemployment: Spiked due to supply and demand shocks.
Fiscal Deficits: Increased as governments provided financial support to affected workers.
Policy Response: Central banks lowered interest rates, then raised them as inflation increased.
Example: The U.S. and Euro area experienced rapid economic contraction followed by inflationary pressures, requiring swift policy adjustments.
World Tour: Public Debt Dynamics
The Increase in Public Debt
Fiscal deficits have led to significant increases in public debt ratios, especially following the global financial crisis and pandemic.
Debt-to-GDP Ratio: Measures the sustainability of a country's debt relative to its economic output.
Trends: U.S., France, and Japan have seen their debt ratios more than double since 2011.
Japan: Debt ratio increased from 74% in 2001 to 161% in 2023.
Debate: Economists disagree on the risks posed by high debt levels.
Formula: Debt-to-GDP Ratio:
US Debt Dynamics: OBBB Act
The "One Big Beautiful Bill Act" (OBBBA) and related fiscal policies have influenced U.S. debt projections and income distribution.
Policy Impact: Changes in fiscal policy affect household resources and income distribution.
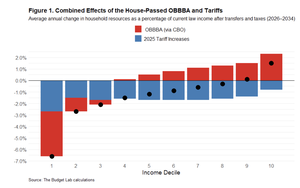
Example: The chart shows the combined effects of OBBBA and tariffs on income deciles, with lower deciles experiencing negative impacts and higher deciles benefiting.
World Tour: China’s Economic Growth
The Growth of China
China's rapid economic growth has transformed its position in the global economy, though its per capita output remains below that of the U.S.
PPP GDP: China's real PPP GDP was 20% of U.S. GDP in 1952, nearly equal by 2017.
Growth Rate: China averaged 5.0% annual growth since 1998, compared to 1.7% for the U.S.
Population: China has 1.4 billion people, U.S. has 330 million.
Per Capita Output: China's output per person is about 22% of U.S. levels.
Formula: PPP GDP per Capita:
Example: Despite high aggregate growth, Chinese citizens have a lower standard of living compared to Americans.
Explanations of Growth in China
China's growth is attributed to high investment in physical and human capital, and institutional reforms.
Physical Capital: Investment in infrastructure, technology, and machinery.
Human Capital: Improved education and training.
Institutional Framework: Shift to market-based policies and openness to trade.
World Tour: Growth & Inequality
Global and Local Inequality Trends
Inequality across countries has decreased, but within countries, especially wealthy ones, it has often increased.
Global Inequality: More equal across countries.
Local Inequality: Increased in the U.S., decreased in France.
Dimensions: Poverty, middle class size, income of the rich.
Example: The U.S. has seen rising income inequality, while France has experienced a decline.
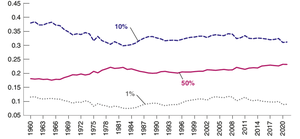
Table Purpose: The chart illustrates the changing shares of income among different groups in France over time.
World Tour: Global Warming
Climate Change and Global Warming
Rising CO2 emissions and global temperatures are linked to human economic activity. Economists advocate for policies to address climate change.
CO2 Emissions: Increased due to industrialization and economic growth.
Policy Recommendations: Carbon taxes (polluter pays principle) and subsidies for green technology.
Transition Costs: Estimated at 2% of GDP annually to limit temperature rise to 1.5°C.
Public Opinion: Resistance to carbon taxes leads to focus on subsidies.
Formula: Carbon Tax:
Example: Governments may subsidize solar power and green energy to meet climate goals.
Summary Table: Key Macroeconomic Issues
Issue | Key Points | Policy Response |
|---|---|---|
COVID-19 Pandemic | Output collapse, inflation, unemployment | Monetary and fiscal stimulus, lockdowns |
Public Debt | Rising debt-to-GDP ratios | Debate on sustainability, fiscal reforms |
China's Growth | High investment, institutional reforms | Market openness, education |
Inequality | Global decrease, local increase | Redistributive policies, tax reforms |
Climate Change | Rising CO2, global warming | Carbon taxes, green subsidies |
