 Back
BackMeasurement of Macroeconomic Variables: National Income, GDP, and Price Indices
Study Guide - Smart Notes
 Tailored notes based on your materials, expanded with key definitions, examples, and context.
Measurement of Macroeconomic Variables
National Income Accounts
National income accounts provide a comprehensive framework for measuring a country's economic activity, including production, income, and expenditure. These accounts were developed in response to the Great Depression, highlighting the need for systematic economic measurement.
Gross Domestic Product (GDP): Measures the value of all goods and services produced within a country's borders, including earnings of foreign residents and firms operating domestically.
Gross National Product (GNP): Includes income earned by residents and firms abroad, but excludes income earned by foreigners within the country.
Example: Profits earned in the US by Toyota Corp are included in GDP, not GNP.
GDP vs. GNP: In countries with significant foreign investment, GDP may exceed GNP.
Gross Domestic Product (GDP)
GDP is a flow measure, calculated over a specific period. It includes only currently produced final goods and services, capital goods, and changes in inventories. GDP is evaluated at market prices (nominal GDP) and excludes non-market activities such as homemaker labor and black-market transactions.
Components of GDP:
Consumption: Household purchases of goods and services (largest component, 65-70%).
Investment: Business fixed investment, residential investment, and changes in inventories (most volatile component).
Government Purchases: Federal, state, and local government spending (excludes transfer payments).
Net Exports: Exports minus imports (imports are subtracted to avoid double counting).
National Income
National income is derived from GNP by subtracting depreciation and statistical discrepancies. It represents income earned from current production by all sources.
GNP: Includes income earned abroad by residents and firms.
National Income Calculation: Subtract depreciation and statistical discrepancy from GNP.
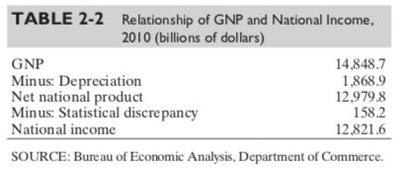
Table Purpose: Shows the stepwise calculation from GNP to National Income for 2010, highlighting deductions for depreciation and statistical discrepancies.
Shares of National Income
National income is distributed among various sources, including wages, corporate profits, rental income, and taxes. The composition of these shares changes over time, reflecting shifts in economic structure.
Wages and Salaries: Largest share of national income.
Corporate Profits, Rental Income, Net Interest: Other significant components.
Supplements and Taxes: Additional sources and deductions.
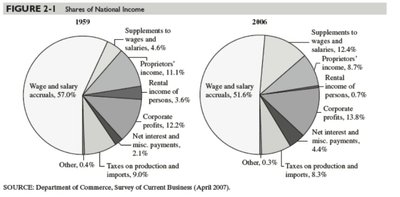
Figure Purpose: Compares the distribution of national income in 1959 and 2006, illustrating changes in wage share, corporate profits, and other components.
Personal and Disposable Income
Disposable income is the portion of national income available to households after taxes and transfers. It is used for consumption, saving, and payments to businesses and foreigners.
Calculation: National income minus corporate profits and taxes, plus transfer payments and government interest payments.
Disposition: Personal consumption, interest paid, transfer payments, and personal saving.
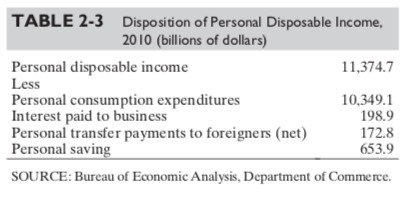
Table Purpose: Details how personal disposable income is allocated in 2010, including consumption, saving, and payments.
National Income Accounting Identities
National income accounting uses identities to relate income, output, and expenditure. These identities simplify analysis by omitting the foreign sector and indirect taxes.
Net Taxes:
Disposable Income:
GDP Expenditure Identity:
Income Side Identity:
Combined Identity:
Measuring Price Changes: Real vs. Nominal GDP
Nominal GDP is measured at current prices and is affected by changes in both price level and production volume. Real GDP adjusts for price changes, reflecting only changes in output quantity. Real GDP is constructed using constant prices from a base year.
GDP Deflator: Ratio of nominal GDP to real GDP, measuring aggregate price level.
Formula:
Real GDP:
Problems: Changing base years alters sector weights; changes in relative prices affect accuracy.
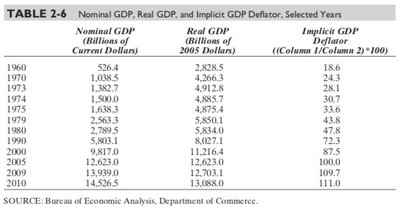
Table Purpose: Provides data for nominal GDP, real GDP, and GDP deflator across selected years, enabling calculation of price level changes.
Consumer Price Index (CPI) and Producer Price Index (PPI)
The CPI measures retail prices of a fixed basket of goods purchased by households, while the PPI tracks wholesale prices of raw materials and intermediate goods. Both indices are used to monitor inflation, with the PPI serving as a leading indicator.
CPI: Weighted average of consumer prices; most relevant for households.
PPI: Wholesale prices; available monthly; leading indicator for inflation.
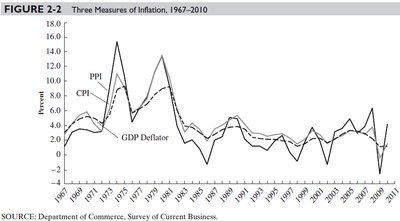
Figure Purpose: Compares CPI, PPI, and GDP deflator as measures of inflation over time.
Measures of Cyclical Variation in Output
Short-run fluctuations in output and employment are known as cyclical variations. These are driven by changes in labor and capital utilization rates. Potential output represents the maximum sustainable output at high resource utilization.
Potential Output: Difficult to measure due to changing technology, labor force, and capital stock.
Short-run Fluctuations: Typically span one to four years.
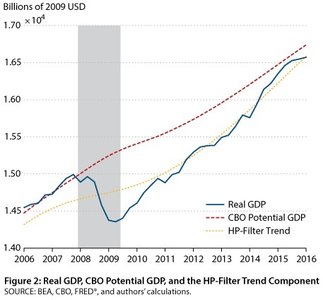
Figure Purpose: Illustrates real GDP, potential GDP, and trend components, highlighting cyclical fluctuations and long-term growth.
Worked Examples and Practice Questions
Students are encouraged to apply concepts by calculating percentage changes in price levels, analyzing potential output, and evaluating real income changes using provided data.
Example Calculation: Percentage change in GDP deflator between 1960 and 1970:
Potential Output: Conceptual explanation and measurement challenges.
Problems with Real GDP: Changing base years and relative prices.
Real Income Calculation: Use GDP deflator to adjust nominal income for inflation.
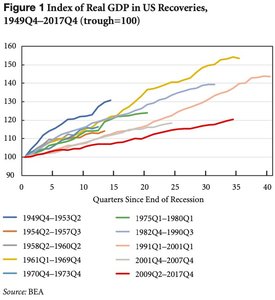
Figure Purpose: Shows real GDP recovery indices across different US recessions, illustrating cyclical variation and recovery patterns.
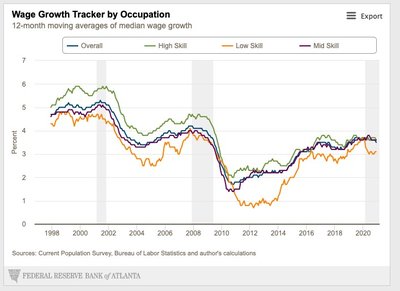
Figure Purpose: Tracks wage growth by occupation, relevant for understanding income distribution and labor market dynamics.
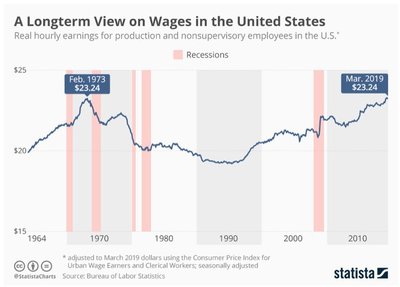
Figure Purpose: Provides a historical perspective on real hourly earnings, adjusted for inflation, highlighting wage trends and recessions.
