 Back
BackMeasuring National Output and National Income: ch 6
Study Guide - Smart Notes
 Tailored notes based on your materials, expanded with key definitions, examples, and context.
Measuring National Output and National Income
Introduction
Understanding how to measure the total output and income of an economy is fundamental in macroeconomics. This section explores the concepts, methods, and limitations of national income accounting, focusing on Gross Domestic Product (GDP), Gross National Product (GNP), and related price indices.
Gross Domestic Product (GDP)
Definition and Scope
Gross Domestic Product (GDP): The total market value of all final goods and services produced within a country during a specific period, typically a year or a quarter.
GDP includes only goods and services currently produced, not transactions involving goods produced in the past.
It measures production within the geographic boundaries of a country, regardless of the ownership of production factors.
Example: The assembly of airplanes in a domestic factory contributes to the country's GDP for the year in which the production occurs.

Final Goods and Services
Final goods and services: Goods and services purchased by their ultimate users, not for resale or further processing.
Intermediate goods: Goods used as inputs in the production of other goods and services. Their value is excluded from GDP to avoid double counting.
Exclusions from GDP
Used goods and paper transactions (e.g., sales of stocks and bonds) are excluded.
Output produced abroad by domestically owned factors is excluded from GDP but included in GNP.
Gross National Product (GNP)
Definition and Comparison with GDP
Gross National Product (GNP): The total market value of all final goods and services produced by a country's citizens, regardless of where the production occurs.
GNP = GDP + Net income from abroad (income earned by nationals abroad minus income earned by foreigners domestically).
Comparison Table:
Country | GNP (million USD) | GDP (million USD) | GNP – GDP (% of GDP) |
|---|---|---|---|
Bangladesh | 127,672 | 116,355 | 9.7 |
Japan | 6,150,132 | 5,961,066 | 3.2 |
China | 8,184,963 | 8,227,103 | -0.5 |
United States | 16,514,500 | 16,244,600 | 1.7 |
India | 1,837,279 | 1,858,740 | -1.2 |
Canada | 1,821,424 | 1,779,635 | 2.3 |
Greece | 250,167 | 248,939 | 0.5 |
Iraq | 216,453 | 215,838 | 0.3 |
Ireland | 171,996 | 210,636 | -18.3 |
The Circular Flow of Income and Expenditure
Basic Structure
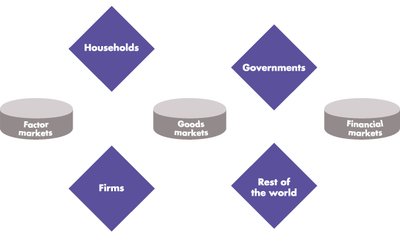
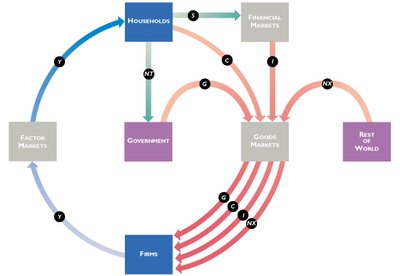
The circular flow diagram illustrates the movement of income and expenditure among the main sectors of the economy: households, firms, government, financial markets, and the rest of the world.
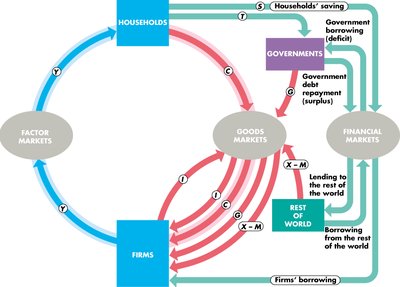
Expanded Circular Flow
As the model is expanded, it incorporates the flows of income (Y), consumption (C), saving (S), investment (I), government spending (G), taxes (T), and net exports (NX).
Methods of Measuring GDP
The Expenditure Approach
This method sums all expenditures on final goods and services produced within a country during a specific period.
Consumption (C): Household spending on goods and services, excluding new housing.
Investment (I): Spending on capital equipment, inventories, and structures, including new housing.
Government Purchases (G): Government spending on goods and services, excluding transfer payments.
Net Exports (NX): Exports minus imports.
The GDP identity:
The Income Approach
This method sums all incomes earned by factors of production in the creation of goods and services, including wages, rents, interest, and profits.
The Value Added Approach
This method calculates GDP by summing the value added at each stage of production, which is the difference between the value of output and the value of intermediate goods used in production.
Nominal versus Real GDP
Definitions
Nominal GDP: Values output using current prices, not adjusted for inflation.
Real GDP: Values output using constant base-year prices, adjusted for inflation.
To compare economic output over time, real GDP provides a more accurate measure by removing the effects of price changes.
Formula for Real GDP:
GDP Deflator
The GDP deflator measures the price level of all new, domestically produced, final goods and services in an economy.
Formula:
Consumer Price Index (CPI) and GDP Deflator
Consumer Price Index (CPI)
The CPI measures the average change over time in the prices paid by urban consumers for a fixed basket of goods and services.
It is calculated as:
Comparison: CPI vs. GDP Deflator
GDP Deflator: Includes all goods and services produced domestically; the basket changes every year.
CPI: Includes only goods and services bought by consumers; the basket is fixed.
Imported goods are included in the CPI but not in the GDP deflator.
Capital goods are included in the GDP deflator if produced domestically, but not in the CPI.
Limitations of GDP as a Measure
GDP and Social Welfare
GDP does not account for the distribution of income, non-market activities, environmental quality, or the value of leisure.
It may not accurately reflect the well-being of a nation's citizens.
The Underground Economy
Economic activity that is not reported to the government is not included in GDP, leading to underestimation of actual output.
Gross National Income Per Capita
Gross National Income (GNI) per capita is often used to compare living standards across countries, adjusting for population size.
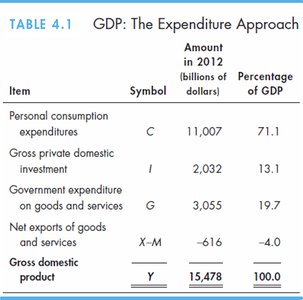
Summary Table: GDP Calculation (Expenditure Approach)
Item | Symbol | Amount in 2012 (billions of dollars) | Percentage of GDP |
|---|---|---|---|
Personal consumption expenditures | C | 11,007 | 71.1 |
Gross private domestic investment | I | 2,032 | 13.1 |
Government expenditure on goods and services | G | 3,055 | 19.7 |
Net exports of goods and services | X-M | -616 | -4.0 |
Gross domestic product | Y | 15,478 | 100.0 |
Key Formulas
GDP (Expenditure Approach):
GDP Deflator:
CPI:
Conclusion
Measuring national output and income is essential for understanding the health and growth of an economy. While GDP and related measures provide valuable insights, it is important to recognize their limitations and complement them with other indicators for a comprehensive view of economic welfare.
