 Back
BackMeasuring National Output and National Income: Macroeconomic Study Guide
Study Guide - Smart Notes
 Tailored notes based on your materials, expanded with key definitions, examples, and context.
Measuring National Output and National Income
Introduction to National Income and Product Accounts (NIPA)
National income and product accounts (NIPA) are essential tools in macroeconomics, providing a systematic record of the economic activity within a country. These accounts help economists and policymakers understand the overall performance of the economy, including production, income, and expenditure.
National Income and Product Accounts (NIPA): Data collected and published by the government describing the various components of national income and output in the economy.
Gross Domestic Product (GDP): The total market value of all final goods and services produced within a given period by factors of production located within a country.
Gross National Product (GNP): The total market value of all final goods and services produced within a given period by factors of production owned by a country’s citizens, regardless of where the output is produced.
Example: GDP measures production within a country, while GNP includes production by citizens abroad.
Aggregate Demand and Aggregate Supply
Aggregate demand and aggregate supply are foundational concepts in macroeconomics, representing the total demand and supply for goods and services in an economy.
Aggregate Demand: The total demand for goods and services in an economy.
Aggregate Supply: The total supply of goods and services in an economy.
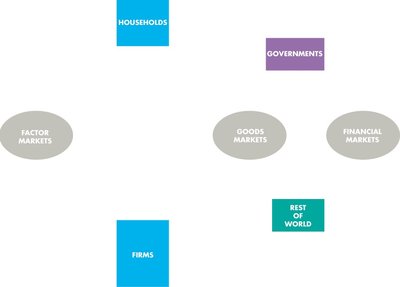
The Circular Flow of Economic Activity
Basic Structure of the Circular Flow
The circular flow diagram illustrates the movement of income and payments between different sectors of the economy, including households, firms, governments, financial markets, and the rest of the world.
Households: Provide factors of production (labor, capital) and receive income.
Firms: Produce goods and services and pay for factors of production.
Governments: Collect taxes and provide public goods and services.
Financial Markets: Facilitate saving and investment.
Rest of the World: Engages in trade (exports and imports).
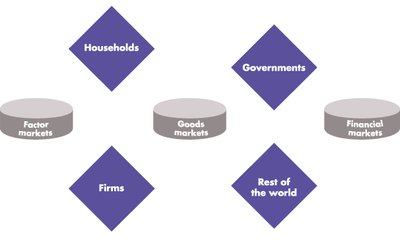
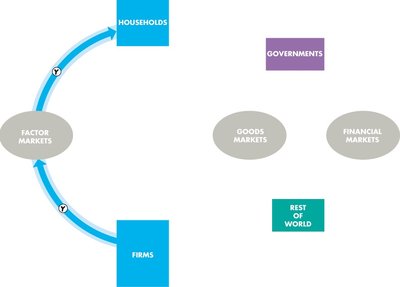
Expanded Circular Flow
As the circular flow model becomes more complex, it incorporates financial markets, government, and international trade, showing the interconnectedness of all sectors.
Factor Markets: Where households sell labor and other resources to firms.
Goods Markets: Where firms sell goods and services to households.
Financial Markets: Where savings and investments occur.
Government: Collects taxes and spends on goods and services.
Rest of the World: Imports and exports goods and services.
Measuring Gross Domestic Product (GDP)
Definition and Scope of GDP
GDP is the most widely used measure of national output. It includes only goods and services produced within a country during a specific period and excludes used goods, paper transactions, and output produced abroad by domestically owned factors.
Final Goods and Services: Goods and services produced for final use, not for further processing.
Intermediate Goods: Goods produced by one firm for use in further processing by another firm.
Value Added: The difference between the value of goods as they leave a stage of production and the cost of the goods as they entered that stage.
Approaches to Calculating GDP
There are three main approaches to calculating GDP: the expenditure approach, the income approach, and the value added approach.
Expenditure Approach: Measures the amount spent on all final goods during a given period.
Income Approach: Measures the income—wages, rents, interest, and profits—received by all factors of production in producing final goods.
Value Added Approach: Sums up the value added at each stage of production or takes the value of final sales.
The Components of GDP
GDP is composed of four main components: consumption, investment, government purchases, and net exports.
Consumption (C): Spending by households on goods and services, excluding purchases of new housing.
Investment (I): Spending on capital equipment, inventories, and structures, including new housing.
Government Purchases (G): Spending on goods and services by local, state, and federal governments, excluding transfer payments.
Net Exports (NX): Exports minus imports.
Formula:
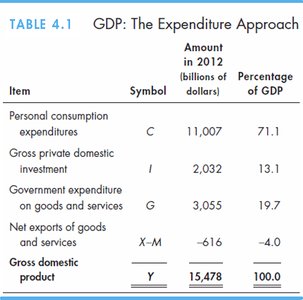
GDP: The Expenditure Approach (Table)
The expenditure approach breaks down GDP into its main components, showing their relative importance.
Item | Symbol | Amount in 2012 (billions of dollars) | Percentage of GDP |
|---|---|---|---|
Personal consumption expenditures | C | 11,007 | 71.1 |
Gross private domestic investment | I | 2,032 | 13.1 |
Government expenditure on goods and services | G | 3,055 | 19.7 |
Net exports of goods and services | X-M | -616 | -4.0 |
Gross domestic product | Y | 15,478 | 100.0 |
Nominal versus Real GDP
Nominal GDP
Nominal GDP values the production of goods and services at current prices, without adjusting for inflation.
Nominal GDP: Measures output using current prices.
Real GDP
Real GDP values the production of goods and services at constant prices, adjusting for inflation to provide a more accurate view of economic growth.
Real GDP: Measures output using constant prices from a base year.
Example: If nominal GDP in 2009 is $100 million and real GDP in 2013 is $160 million, real GDP has increased by 60%.
GDP Deflator
The GDP deflator is a measure of the price level, calculated as the ratio of nominal GDP to real GDP multiplied by 100.
Formula:
Purpose: To adjust nominal GDP for changes in the price level.
Consumer Price Index (CPI) and Inflation
Consumer Price Index (CPI)
The CPI measures the average prices paid by urban consumers for a fixed market basket of consumer goods and services. It is used to track changes in the cost of living and inflation.
CPI Formula:
Example: If the cost of the basket is CPI = \frac{70}{50} \times 100 = 140 $.
Comparing CPI and GDP Deflator
While both CPI and GDP deflator measure inflation, they differ in scope and calculation:
CPI: Includes prices of imported consumer goods and uses a fixed basket.
GDP Deflator: Includes prices of domestically produced capital goods and uses a changing basket.
Limitations of GDP
GDP and Social Welfare
GDP is not a perfect measure of social welfare. It does not account for the underground economy, environmental degradation, or non-market activities such as household labor.
Underground Economy: Economic activity not reported to the government.
Non-market Activities: Services and production not sold in markets (e.g., household work).
Summary Table: GNP vs. GDP in Select Countries (2012)
This table compares GNP and GDP for several countries, highlighting the differences based on production location and ownership.
Country | GNP | GDP | GNP – GDP (% of GDP) |
|---|---|---|---|
Bangladesh | 127,672 | 116,355 | 9.7 |
Japan | 6,150,132 | 5,961,066 | 3.2 |
China | 8,184,963 | 8,227,103 | -0.5 |
United States | 16,514,500 | 16,244,600 | 1.7 |
India | 1,837,279 | 1,858,740 | -1.2 |
Canada | 1,821,424 | 1,779,635 | 2.3 |
Greece | 250,167 | 248,939 | 0.5 |
Iraq | 216,453 | 215,838 | 0.3 |
Ireland | 171,996 | 210,636 | -18.3 |
Key Formulas and Concepts
GDP (Expenditure Approach):
GDP Deflator:
CPI:
Conclusion
Measuring national output and income is fundamental to understanding macroeconomic performance. GDP, GNP, CPI, and the GDP deflator are key tools for tracking economic activity, growth, and inflation. However, each measure has limitations, and a comprehensive view of economic welfare requires considering additional factors beyond these statistics.
