 Back
BackMeasuring the Price Level and Inflation: The Consumer Price Index and Related Concepts
Study Guide - Smart Notes
 Tailored notes based on your materials, expanded with key definitions, examples, and context.
Measuring the Aggregate Price Level
Definition and Importance
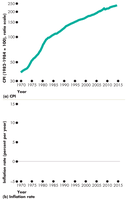
The aggregate price level is a single number that represents the average level of prices for a wide range of goods and services in an economy. It is crucial for understanding the value of money and tracking changes in the cost of living over time.
Inflation: A persistently rising aggregate price level.
Deflation: A persistently falling aggregate price level.
Tracking the price level helps measure inflation/deflation rates and distinguish between nominal and real values of economic variables.
Constructing a Price Index
Market Baskets and Price Indices
To measure the aggregate price level, economists use a market basket—a collection of goods and services typically purchased by households. The price index expresses the current cost of this basket relative to a base period.
Selection of goods: Should reflect what households, firms, or the government are buying.
Weighting: Not all goods are weighted equally; weights reflect their importance in consumer spending.
Price Index Formula
The price index in a given year is calculated as:
Example: If the basket costs \frac{152.50}{115} \times 100 = 132.6$.
Types of Price Indices
Laspeyres, Paasche, and Fisher Indices
Laspeyres Index: Uses base period quantities (e.g., CPI).
Paasche Index: Uses current period quantities (e.g., GDP Deflator).
Fisher Index: Geometric average of Laspeyres and Paasche indices (e.g., chain-weighted GDP deflator).
The Consumer Price Index (CPI)
Definition and Construction
The Consumer Price Index (CPI) measures the average level of prices of goods and services consumed by urban households. It is published by the Bureau of Labor Statistics (BLS).
Tracks changes in the typical household’s cost of living.
Used for adjusting contracts for inflation (COLAs) and comparing dollar amounts over time.
Steps in Constructing the CPI
Survey consumers to determine the composition of the typical consumer’s basket.
Collect monthly price data for all items in the basket.
Compute the cost of the basket and calculate the CPI:
Example Calculation
Suppose the CPI basket is 10 oranges and 5 haircuts.
Base period cost: $50; Current period cost: $70.
(CPI is 40% higher than in the base period).
Measuring Inflation
Definition and Calculation
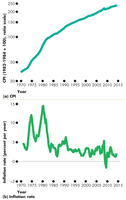
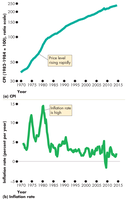
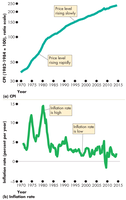
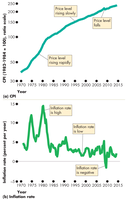
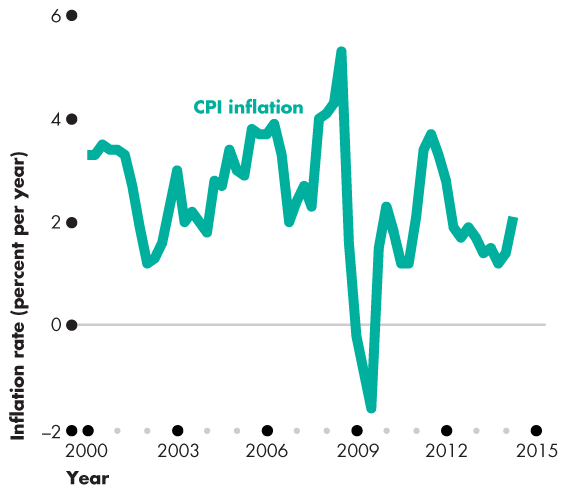
The main purpose of the CPI is to measure inflation, which is the percentage change in the price level from one year to the next.
High inflation: Price level rising rapidly.
Low inflation: Price level rising slowly.
Negative inflation: Price level falling (deflation).
Core Inflation
Definition and Application
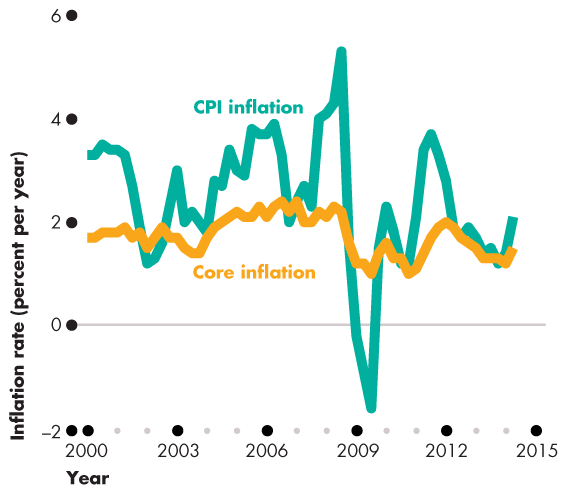
Core inflation is the CPI inflation rate excluding volatile elements such as food and fuel. It attempts to reveal the underlying inflation trend and is used by policymakers to guide monetary policy.
Exercise: Calculating CPI and Inflation Rate
Worked Example
Given a basket containing 20 pizzas and 10 UHD Blu-ray discs, with prices over several years:
2017: Pizza $10, UHD $15
2018: Pizza $11, UHD $15
2019: Pizza $12, UHD $16
2020: Pizza $13, UHD $15
For each year, calculate:
Cost of the basket
CPI (using 2017 as the base year)
Inflation rate from the preceding year
Year | Cost of Basket | CPI | Inflation Rate |
|---|---|---|---|
2017 | $350 | 100.0 | n.a. |
2018 | $370 | 105.7 | 5.7% |
2019 | $400 | 114.3 | 8.1% |
2020 | $410 | 117.1 | 2.5% |
Biases in the CPI
Sources of Bias
The CPI may overstate true inflation due to four main biases:
New goods bias: New goods not available in the base year may be more expensive than those they replace.
Quality change bias: Quality improvements are often neglected, so price increases due to quality are counted as inflation.
Commodity substitution bias: The fixed basket does not account for consumers substituting away from goods whose prices rise.
Outlet substitution bias: Changes in retailing (e.g., buying from cheaper sources) are not reflected in the CPI.
Estimated CPI bias: Overstates inflation by about 1.1 percentage points per year, leading to significant consequences for contracts and government outlays.
Alternative Price Indices
Other Measures
Chained CPI: Uses a method similar to chained-dollar real GDP.
Producer Price Index (PPI): Measures prices of goods important to producers; includes raw materials and intermediate inputs.
Personal Consumption Expenditure (PCE) Deflator: ; broader than CPI, includes all consumption expenditure.
GDP Deflator: Includes prices of all goods and services counted in GDP.
Real Variables in Macroeconomics
Deflating Nominal Variables
To find real values, nominal variables are deflated using a price index. For example, real wage rate:
If you earn $100/week and CPI = 50, your real wage is 2 consumer baskets; if CPI = 100, your real wage is 1 consumer basket.
Note: The real interest rate is calculated differently.
Problems Caused by Inflation and Deflation
Economic Consequences
Low, steady, and anticipated inflation or deflation is not problematic. Unpredictable inflation or deflation can:
Redistribute income and wealth
Lower real GDP and employment
Divert resources from productive activities
Review Questions
What is a price index?
How is a price index constructed?
How do you calculate and interpret the value of a price index?
What is a base year?
What are the differences between various price indices?
How is inflation calculated?
Why might the CPI be overstated?
Why are inflation and deflation problematic?
How do you deflate a nominal variable into a real one?
