 Back
BackNational Income Accounting and Gross Domestic Product (GDP): Principles of Macroeconomics Study Notes
Study Guide - Smart Notes
 Tailored notes based on your materials, expanded with key definitions, examples, and context.
Gross Domestic Product (GDP)
Definition and Key Components
Gross Domestic Product (GDP) is a central concept in macroeconomics, representing the market value of all final goods and services produced within a country during a specific time period. Understanding GDP is essential for measuring a nation's economic performance and comparing living standards across countries and over time.
Market Value: GDP values goods and services at their market prices, allowing aggregation of diverse products into a single monetary measure.
Final Goods and Services: Only goods and services purchased by their final users are included in GDP. Intermediate goods, which are used as inputs in the production of final goods, are excluded to avoid double counting.
Produced Within a Country: GDP measures the value of production that occurs within a nation's borders, regardless of the nationality of the producers.
In a Given Time Period: GDP is measured over a specific interval, typically a year or a quarter.
Example:
If a car is produced in the United States and sold to a consumer, its value is included in U.S. GDP for that year. However, the value of the tires purchased by the car manufacturer is not counted separately, as it is already included in the value of the final car.
Market Value
GDP aggregates the value of all goods and services using their market prices. This approach enables the comparison and summation of different products, such as apples and computers, by expressing their value in monetary terms.
Final vs. Intermediate Goods
Final Good: An item bought by its final user during a specified time period.
Intermediate Good: An item produced by one firm, bought by another, and used as a component in a final good or service.
Excluding intermediate goods prevents double counting in GDP calculations.
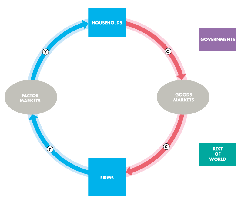
GDP and the Circular Flow of Income and Expenditure
GDP measures the total value of production, which is equal to total expenditure on final goods and services and total income earned from production. This equivalence is illustrated by the circular flow model, which shows the interactions among households, firms, governments, and the rest of the world.
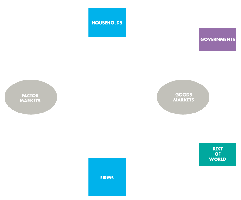
The Circular Flow Diagram
The circular flow diagram visually represents the flow of goods, services, and money in an economy. It highlights the equality of income, expenditure, and the value of production.
GDP Identity
The sum of all expenditures on final goods and services equals the total income generated in the production of those goods and services. This relationship is expressed by the GDP identity:
Y: Aggregate income (GDP)
C: Consumption expenditure
I: Investment expenditure
G: Government purchases
X: Exports
M: Imports

Measuring GDP: Expenditure and Income Approaches
The Expenditure Approach
This approach sums all expenditures on final goods and services produced within a country during a given period. The main components are:
Consumption (C): Spending by households on goods and services.
Investment (I): Spending on capital goods that will be used for future production.
Government Purchases (G): Expenditures by government on goods and services.
Net Exports (X - M): Exports minus imports.
The Income Approach
This approach sums all incomes earned by factors of production in the economy, including wages, interest, rent, and profit. In theory, the total income should equal total expenditure, as all spending on goods and services becomes income for someone else.
Stocks vs. Flows
Definitions and Examples
Understanding the distinction between stocks and flows is crucial in macroeconomics:
Stock: A quantity measured at a specific point in time (e.g., wealth, capital stock, government debt).
Flow: A quantity measured per unit of time (e.g., income, investment, government budget deficit).
Examples:
"U.S. investment was $2.5 trillion during 2006" (flow)
"The U.S. capital stock was $26 trillion on January 1, 2006" (stock)
Relationship Between Stocks and Flows
Wealth is a stock; saving is the flow that changes wealth.
Capital is a stock; investment is the flow that changes capital.
Depreciation (or capital consumption) is the reduction in the capital stock due to wear and tear or obsolescence.
Gross and Net Investment
Definitions
Gross Investment: The total amount spent on new capital and replacing depreciated capital.
Net Investment: The change in the capital stock, calculated as gross investment minus depreciation.
Financing Investment and the Role of Saving
Sources of Investment Finance
Investment in an economy is financed from three main sources:
Private Saving (Sp): Income minus net taxes and consumption expenditure. Formula:
Government Saving (Sg): Net taxes minus government purchases. Formula:
Borrowing from the Rest of the World: If imports exceed exports, the country borrows from abroad; if exports exceed imports, the country lends to the rest of the world.
National Saving
National saving is the sum of private and government saving:
Practice Questions and Applications
Which transactions are included in GDP? Only the purchase of new goods and services produced within the year (e.g., a new car) is included; used goods and financial transactions are excluded.
Effect of Increased Investment Spending: An increase in investment spending typically leads to an increase in nominal GDP.
Public Savings: Calculated as net taxes minus government purchases. If negative, the government runs a budget deficit.
Consumer Spending: The total amount households spend on goods and services, a key component of GDP.
Summary Table: Stocks vs. Flows
Concept | Stock | Flow |
|---|---|---|
Government | Debt | Budget Deficit |
Education | # of people with degrees | # of new graduates this year |
Personal Finance | Wealth | Annual Saving |
Capital | Capital Stock | Investment |
