 Back
BackOpportunity Cost and the Production Possibilities Curve (PPC)
Study Guide - Smart Notes
 Tailored notes based on your materials, expanded with key definitions, examples, and context.
Economic Issues and Concepts
Opportunity Cost: Definition and Calculation
The concept of opportunity cost is fundamental in economics, representing the value of the next best alternative foregone when a choice is made. In macroeconomics, opportunity cost is often illustrated using the Production Possibilities Curve (PPC), which shows the trade-offs between two goods or services that an economy can produce.
Opportunity Cost: The amount of one good or service that must be given up to obtain an additional unit of another good or service.
Formula for Opportunity Cost of Healthcare:
Formula for Opportunity Cost of Education:
Interpretation: The opportunity cost of Healthcare is the amount of Education sacrificed to gain one unit of Healthcare, and vice versa.
Example: Calculating Opportunity Cost Using the PPC
The PPC below illustrates the trade-off between Education (measured in hundreds) and Healthcare (measured in thousands). Each point on the curve represents a different allocation of resources between the two goods.
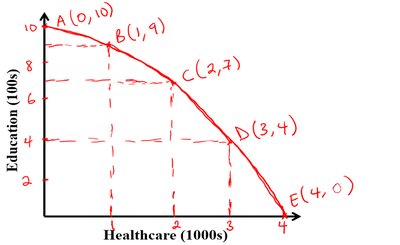
Movement from A to B: Opportunity cost of Healthcare = 0.1 (units of Education per unit of Healthcare)
Movement from B to C: Opportunity cost of Healthcare = 0.2
Movement from C to D: Opportunity cost of Healthcare = 0.3
Movement from D to E: Opportunity cost of Healthcare = 0.4
Movement from E to D: Opportunity cost of Education = 2.5 (units of Healthcare per unit of Education)
Movement from D to C: Opportunity cost of Education = 3.3
Movement from C to B: Opportunity cost of Education = 5.0
Movement from B to A: Opportunity cost of Education = 10.0
Interpreting Opportunity Cost Values
Opportunity cost values are always stated as absolute numbers. The negative sign in calculations signifies the direction of trade-off, but the magnitude (absolute value) is what matters for economic interpretation.
Increasing Opportunity Cost: As more of one good is produced, the opportunity cost in terms of the other good increases. This is reflected in the PPC's concave shape.
Constant Opportunity Cost: If the opportunity cost remains the same for each additional unit, the PPC is a straight line.
Decreasing Opportunity Cost: If the opportunity cost decreases as more of a good is produced, the PPC is convex from the origin.
Production Possibilities Curve (PPC): Types and Examples
The PPC can take different shapes depending on the nature of opportunity costs:
Increasing Opportunity Cost: Most common in practice due to resource specialization.
Constant Opportunity Cost: Occurs when resources are equally suited for both goods.
Decreasing Opportunity Cost: Rare, but possible if resources become more efficient in producing one good as production increases.
Example: Constant Opportunity Cost in Practice
Consider two friends, Jack and Steve, who can catch fish and trap rabbits while camping. Their production possibilities are shown below:
Fish | Rabbits | |
|---|---|---|
Jack | 6 | 5 |
Steve | 4 | 3 |
Jack's Opportunity Cost of Trapping Rabbits: (Fish per Rabbit)
Jack's Opportunity Cost of Catching Fish: (Rabbits per Fish)
Steve's Opportunity Cost of Trapping Rabbits:
Steve's Opportunity Cost of Catching Fish:
When resources are allocated efficiently, the maximum food available is determined by combining their production possibilities.
Application of Opportunity Cost in Microeconomics
Opportunity cost is not only relevant for economies as a whole, but also for individual decision makers such as students, consumers, and firms. Each must consider the trade-offs involved in their choices to maximize utility or profit.
Example: A student deciding between studying for an exam or working a part-time job must consider the opportunity cost of each option.
