 Back
BackProduction, Productivity, and Growth Accounting in Macroeconomics
Study Guide - Smart Notes
 Tailored notes based on your materials, expanded with key definitions, examples, and context.
Production and Employment
Overview of Aggregate Production
In macroeconomics, the aggregate production function describes the relationship between total output (GDP) and the inputs used in production, primarily capital and labor. Understanding this relationship is fundamental for analyzing productivity, growth, and the effects of technological change.
GDP Identity: , where Y is output, C is consumption, I is investment, G is government spending, and NX is net exports.
Aggregate Production Function: , where:
Y = real output produced
A = total factor productivity (TFP)
K = capital stock (quantity of capital used)
N = number of workers employed
TFP (A): Measures the effectiveness with which capital and labor are used. Improvements in technology or organizational efficiency increase A.
Properties of the Production Function
Constant Returns to Scale (CRS)
A production function exhibits constant returns to scale if increasing all inputs by a factor b increases output by the same factor:
Mathematically:
Example: Doubling both K and N doubles output.
Cobb-Douglas Production Function
The Cobb-Douglas function is a commonly used form:
If , then
Doubling both K and N:
Doubling only N (holding K fixed): Output increases by less than double due to diminishing returns to labor.
Marginal Products and Diminishing Returns
Marginal Product of Labour (MPN)
The marginal product of labor measures the additional output produced by an extra unit of labor, holding capital constant:
(with K fixed)
MPN is positive: Increasing N increases Y.
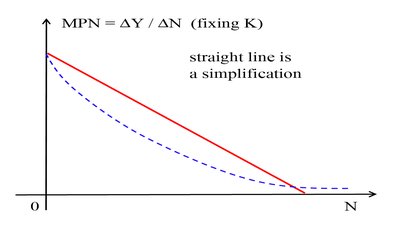
MPN declines as N increases: This is the law of diminishing marginal productivity of labor.
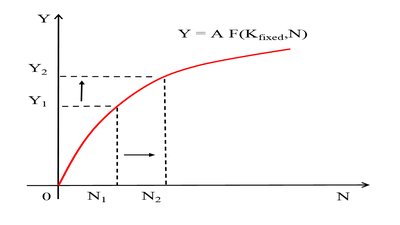
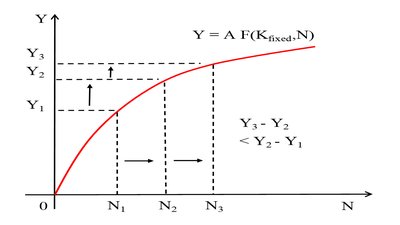
As more labor is added, each additional worker contributes less to output than the previous one, due to the fixed amount of capital.
Marginal Product of Capital (MPK)
The marginal product of capital is the additional output from an extra unit of capital, holding labor constant:
(with N fixed)
MPK also declines as K increases, reflecting diminishing returns to capital.
Graphical Representation of MPN
The MPN curve shows the relationship between labor input and its marginal product, typically downward sloping due to diminishing returns.
Supply (Productivity) Shocks
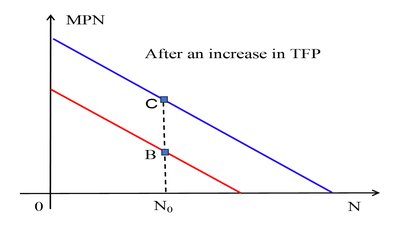
Impact of Total Factor Productivity (TFP) Changes
A supply shock, such as an increase in TFP (A), shifts the production function upward, allowing more output to be produced with the same inputs. This also shifts the MPN and MPK curves upward.
Positive supply shock: More output for any (K, N) combination.
MPN and MPK increase for any given level of inputs.
Growth Accounting
Decomposing Output Growth
Growth accounting breaks down the growth rate of output into contributions from capital, labor, and TFP:
Assume Cobb-Douglas:
Growth rate approximation:
TFP growth is the portion of output growth not explained by capital or labor growth.
GDP per Capita and Labour Productivity
GDP per Capita
GDP per capita measures average output per person:
: Fraction of population in the labor force
: Output per worker (labor productivity)
Growth in GDP per Capita
Growth rate:
If is stable, growth in GDP per capita comes from growth in labor productivity.
Labour Productivity and Capital-Labour Ratio
From Cobb-Douglas:
Growth in labor productivity:
TFP growth is a key driver of labor productivity and, thus, GDP per capita growth.
Additional info: TFP captures not only technological progress but also improvements in efficiency, management, and other factors not directly measured by capital or labor inputs.
