 Back
BackProduction, Productivity, and Labour Markets in Macroeconomics
Study Guide - Smart Notes
 Tailored notes based on your materials, expanded with key definitions, examples, and context.
Production and Productivity
Aggregate Production Function
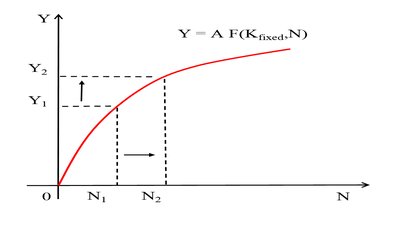
The aggregate production function describes the relationship between total output and the inputs used in production, typically capital and labour. It is a foundational concept in macroeconomics for understanding how economies generate goods and services.
General Form:
= Real output produced
= Total Factor Productivity (TFP), measuring the effectiveness of input use
= Capital stock (quantity of capital used)
= Number of workers employed
TFP (A): Reflects technology, efficiency, and other factors not captured by capital and labour quantities.
Why Ignore Other Inputs? Materials and other inputs are often omitted for simplicity, as capital and labour are the primary drivers in macro models.
Properties of the Production Function
Constant Returns to Scale (CRS): If all inputs are increased by a factor , output increases by the same factor: .
Cobb-Douglas Example:
Doubling both and doubles output.
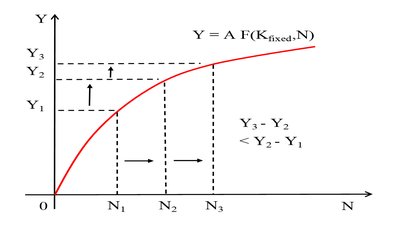
Doubling only (with fixed) increases output by less than double due to diminishing returns.
Marginal Products
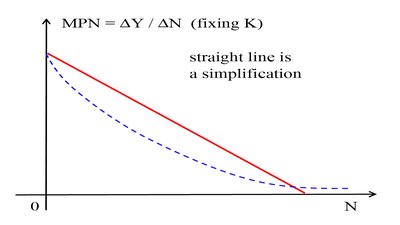
Marginal Product of Labour (MPN): The additional output from employing one more worker, holding capital fixed.
Formula: (with fixed)
MPN is positive but diminishes as increases (diminishing marginal returns).
Marginal Product of Capital (MPK): The additional output from increasing capital, holding labour fixed.
Formula: (with fixed)
MPK also diminishes as increases.
Example: For , as increases from 1 to 2, increases from 10 to 16.2, so . As increases further, continues to fall.
Supply (Productivity) Shocks
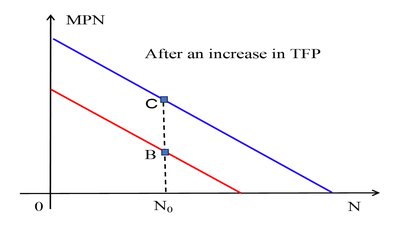
Productivity shocks shift the production function. A positive shock (increase in ) raises output for any given and , and shifts the MPN and MPK curves upward.
Growth Accounting
Growth accounting decomposes output growth into contributions from capital, labour, and TFP.
Cobb-Douglas Function:
Growth Rate Approximation:
TFP Growth:
GDP per Capita and Labour Productivity
GDP per Capita:
: Labour force participation rate
: Output per worker (labour productivity)
Labour Productivity (Cobb-Douglas):
Growth in GDP per capita is driven by growth in labour productivity and participation rates.
Unemployment
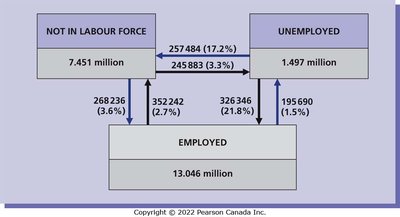
Labour Market Statuses
Employed: Worked during the past week
Unemployed: Did not work but actively sought work in the past four weeks
Out of Labour Force: Did not work and did not seek work
Labour Force: Employed + Unemployed
Key Labour Market Ratios (2023)
Unemployment Rate: Fraction of labour force unemployed (~5.4%)
Participation Rate: Fraction of working-age population in the labour force (~65.6%)
Employment Ratio: Fraction of working-age population employed (~62.1%)
Labour Market Flows
The labour market is dynamic, with workers moving between employment, unemployment, and out of the labour force. Most unemployment spells are short, but most unemployed at a point in time are long-term unemployed.
Types of Unemployment
Frictional Unemployment: Due to time needed for job search and matching
Structural Unemployment: Long-term, due to mismatches between worker skills and job requirements
Cyclical Unemployment: Due to economic downturns (recessions)
Natural Rate of Unemployment (): Unemployment from frictional and structural causes when the economy is at full employment
Who is Unemployed?
Unemployment rates are higher among males, the young, and the less educated.
Labour Supply
Labour Supply and Real Wages
Labour supply decisions involve a trade-off between work and leisure. The response to wage changes involves two effects:
Substitution Effect: Higher wages increase the incentive to work more (labour supplied rises).
Income Effect: Higher wages increase income, allowing more leisure (labour supplied falls).
For temporary wage changes, the substitution effect dominates; for permanent changes, the income effect dominates.
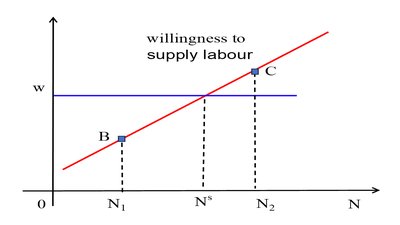
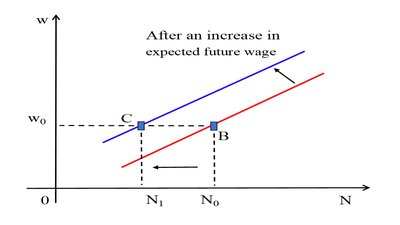
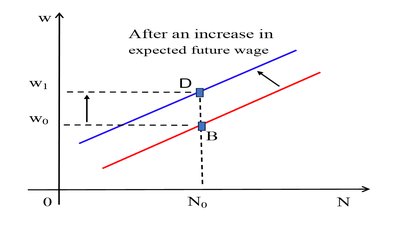
Labour Supply Curve
The labour supply curve shows the relationship between the real wage and the quantity of labour supplied, holding other factors constant. Shifts occur with changes in wealth or expected future wages.
Aggregate Labour Supply
Higher real wages increase aggregate labour supply both by increasing hours worked (intensive margin) and by encouraging labour force participation (extensive margin).
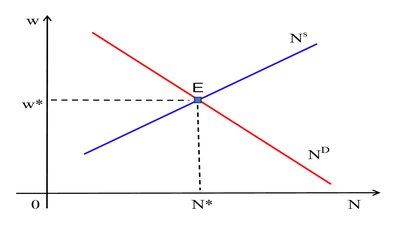
Classical Labour Market Equilibrium
In the classical model, the real wage adjusts to equate labour supply and demand, resulting in full employment () and the market-clearing wage ().
Labour Demand
Labour Demand and Marginal Product of Labour
Marginal Revenue Product of Labour (MRPN): The extra revenue from hiring one more worker:
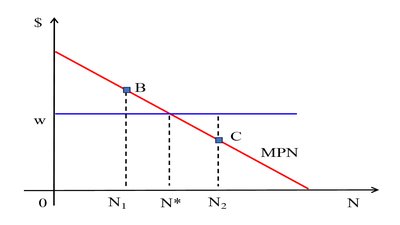
Profit Maximization: Firms hire workers up to the point where (real wage).
The labour demand curve is downward sloping due to diminishing MPN.

Technological Change and Labour Demand
Technological improvements generally increase TFP and shift labour demand outward, raising wages and employment in the long run.
However, technology can also change the relative demand for skilled vs. unskilled workers, contributing to wage inequality.
Summary Table: Key Labour Market Concepts
Concept | Definition |
|---|---|
MPN | Marginal Product of Labour: |
MPK | Marginal Product of Capital: |
TFP | Total Factor Productivity: Efficiency parameter in production |
Unemployment Rate | Unemployed / Labour Force |
Participation Rate | Labour Force / Working-age Population |
Equilibrium Employment | Where Labour Supply = Labour Demand |
Additional info: The above notes expand on the provided slides by including definitions, formulas, and context for each concept, ensuring a self-contained and comprehensive study guide for macroeconomics students.
