 Back
BackProduction, Productivity, Growth Accounting, Unemployment, and Labour Markets: Study Notes for Macroeconomics
Study Guide - Smart Notes
 Tailored notes based on your materials, expanded with key definitions, examples, and context.
Production and Productivity
Aggregate Production Function
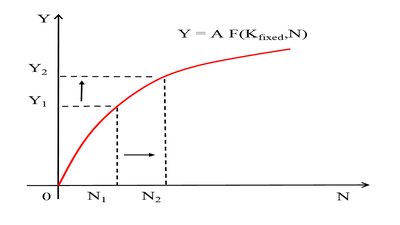
The aggregate production function is a fundamental concept in macroeconomics, relating total output to the inputs used in production. It is typically expressed as:
Y = A F(K, N), where:
Y: Real output produced
A: Total factor productivity (TFP), measuring the effectiveness of capital and labour utilization
K: Capital stock (quantity of capital used)
N: Number of workers employed
Other inputs, such as materials, are often ignored for simplicity, focusing on capital and labour as primary factors.
Properties of the Production Function
Total factor productivity (TFP) reflects improvements in technology or efficiency. It may also capture productivity embodied in capital and labour, such as advanced machinery or skilled workers.
Constant Returns to Scale
A production function exhibits constant returns to scale if increasing all inputs by a factor b results in output increasing by the same factor:
Example: Doubling all inputs doubles output.
Cobb-Douglas Production Function
The Cobb-Douglas function is a common form:
If , then
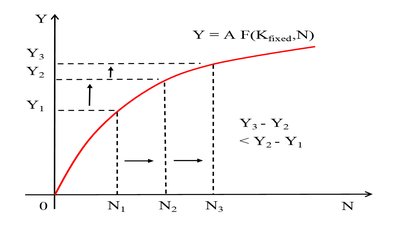
Doubling only one input (e.g., labour) increases output by less than double due to the constraint imposed by the fixed input.
Marginal Product of Labour (MPN)
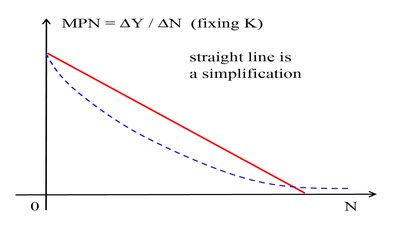
The marginal product of labour measures the increase in output from a small increase in labour, holding capital constant:
MPN is positive but declines as N increases, reflecting diminishing marginal productivity.
Marginal Product of Capital (MPK)
MPK measures the increase in output from a small increase in capital, holding labour constant:
MPK also declines as K increases.
Supply (Productivity) Shocks
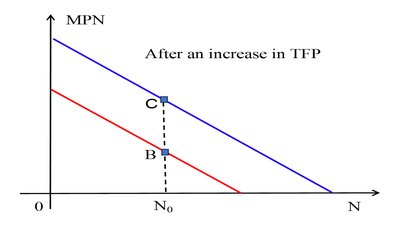
A supply shock, such as an increase in TFP, shifts the production function upward, allowing more output for any combination of inputs. Both MPN and MPK curves shift up.
Growth Accounting
Growth accounting decomposes output growth into contributions from TFP, capital, and labour:
Assume Cobb-Douglas:
Growth rate approximation:
TFP growth is calculated as:
GDP per Capita and Labour Productivity
GDP per capita is determined by the fraction of the population in the labour force and output per worker:
Growth in GDP per capita depends on growth in labour productivity and labour force participation.
Labour productivity:
Unemployment
Employment States
The labour market consists of three main statuses:
Employed: Worked during the past week
Unemployed: Did not work but actively sought work in the past four weeks
Out of the labour force: Did not work and did not seek work
Labour force = employed + unemployed
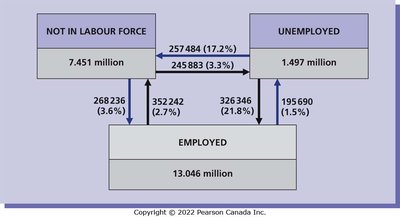
Labour Market Flows
The labour market is dynamic, with workers moving between employment, unemployment, and out of the labour force. Most unemployment spells are short, but most unemployed at a given time are long-term unemployed.
Types of Unemployment
Frictional unemployment: Due to search and matching processes
Structural unemployment: Long-term, caused by skill mismatches or technological change
Cyclical unemployment: Due to economic downturns
Natural Rate of Unemployment
The natural rate (\bar{u}) is the rate prevailing at full employment, caused by frictional and structural factors. Cyclical unemployment is the difference between actual and natural rates.
Unemployment Demographics
Higher rates among males, youth, and less educated individuals
Labour Supply
Labour Supply and Real Wages
Labour supply responds to real wages through two effects:
Substitution effect: Higher wages increase labour supplied
Income effect: Higher wages decrease labour supplied, as leisure is a normal good
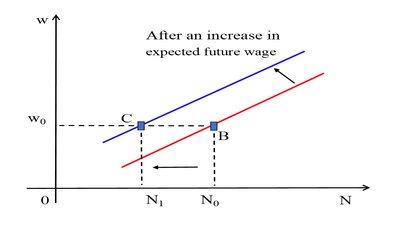
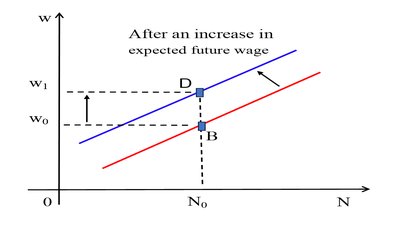
For temporary wage changes, substitution dominates; for permanent changes, income effect dominates
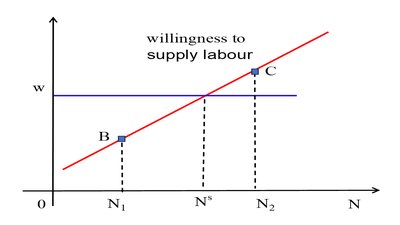
Labour Supply Curve
The labour supply curve relates labour supplied to the current real wage, holding other factors constant. Changes in wealth or expected future wages shift the curve.
Aggregate Labour Supply
Higher real wages increase aggregate labour supply via intensive (more hours) and extensive (more workers) margins
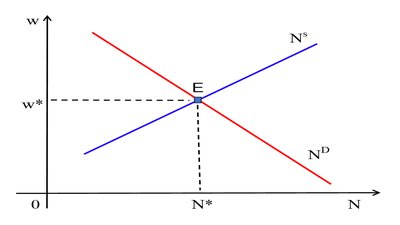
Classical Labour Market Equilibrium
In the classical model, real wages adjust to equate labour supply and demand, resulting in full employment and market-clearing wage.
Labour Demand
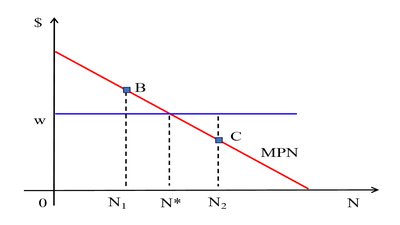
Labour Demand and Marginal Product
Firms demand labour based on the marginal product of labour (MPN) and the real wage:
Profit-maximizing firms hire until
MPN curve is downward sloping due to diminishing returns
Impact of Technology on Labour Demand
Technological improvements generally increase TFP and shift labour demand outward, though effects may differ for skilled and unskilled workers.

Skill-Biased Technological Change
Recent changes have increased productivity of skilled workers more than unskilled
Wage inequality has grown, especially among males
Summary Table: Labour Market Statuses and Flows
Status | Population (millions) | Flow to Employed | Flow to Unemployed |
|---|---|---|---|
Not in Labour Force | 7.451 | 352,242 (2.7%) | 257,484 (17.2%) |
Unemployed | 1.497 | 326,346 (21.8%) | 195,690 (1.5%) |
Employed | 13.046 | 268,236 (3.6%) | 245,883 (3.3%) |
Additional info: Table summarizes monthly flows between employment states in Canada, illustrating labour market dynamics.
