 Back
BackTaxes and Subsidies in Competitive Markets: Effects on Supply, Demand, and Welfare
Study Guide - Smart Notes
 Tailored notes based on your materials, expanded with key definitions, examples, and context.
Introduction to Taxes and Subsidies in Markets
Overview
Taxes and subsidies are important policy tools that governments use to influence market outcomes. In competitive markets, these interventions affect supply and demand, alter equilibrium prices and quantities, and redistribute welfare among consumers, producers, and the government.
Tax: A compulsory financial charge imposed by the government on goods or services, typically shifting supply or demand curves.
Subsidy: A financial assistance provided by the government to encourage production or consumption, shifting supply or demand curves in the opposite direction of a tax.
Effects of Taxes on the Oil Market
Supply and Demand Shifts Due to Tax
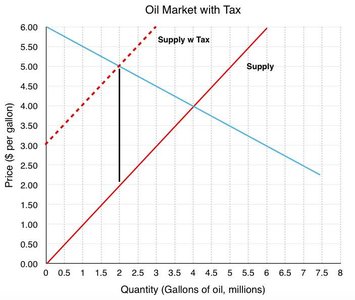
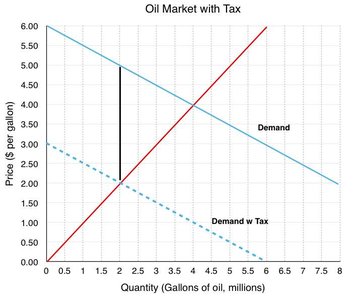
When a tax is imposed on a good, it can be levied on either producers (supply side) or consumers (demand side). The tax increases the cost, causing the supply curve to shift upward (left) or the demand curve to shift downward (left).
Supply with Tax: The supply curve shifts upward by the amount of the tax, reflecting higher costs for producers.
Demand with Tax: The demand curve shifts downward by the amount of the tax, reflecting higher prices for consumers.
Tax Incidence and Price Effects
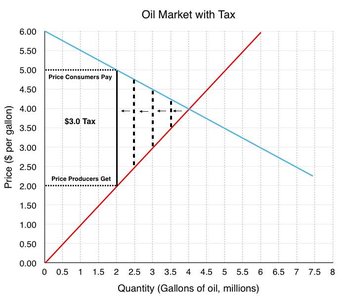
The burden of a tax is shared between consumers and producers, depending on the relative elasticities of supply and demand. The price consumers pay increases, while the price producers receive decreases.
Tax Incidence: The division of the tax burden between buyers and sellers.
Price Effects: The vertical distance between the supply and demand curves equals the tax amount.
Welfare Effects: Consumer Surplus, Producer Surplus, Government Revenue, and Deadweight Loss
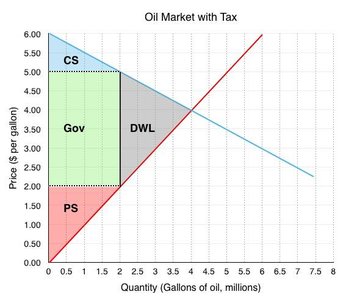
Taxes reduce total welfare in the market by creating deadweight loss (DWL), which represents lost gains from trade. The government collects tax revenue, while consumer surplus (CS) and producer surplus (PS) decrease.
Consumer Surplus (CS): The area above the price paid and below the demand curve.
Producer Surplus (PS): The area below the price received and above the supply curve.
Government Revenue: The rectangle representing tax collected on each unit sold.
Deadweight Loss (DWL): The triangle representing lost welfare due to reduced quantity traded.
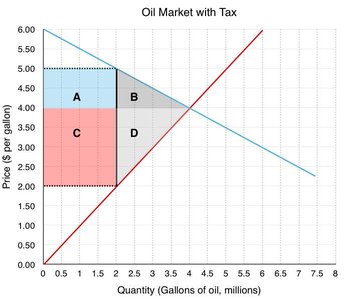
Area Analysis in Taxed Market
Market diagrams can be divided into labeled areas to analyze changes in welfare.
Area A: Consumer surplus after tax.
Area B: Deadweight loss.
Area C: Producer surplus after tax.
Area D: Government revenue.
Effects of Subsidies on the Housing Market
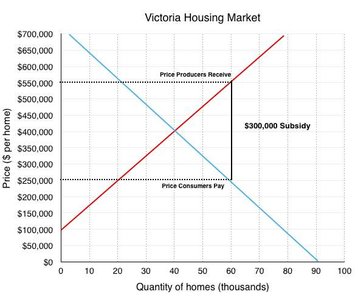
Subsidy Shifts and Price Effects
A subsidy lowers the cost for producers or consumers, shifting the supply curve downward (right) or the demand curve upward (right).
Supply with Subsidy: Producers receive a higher price, increasing supply.
Demand with Subsidy: Consumers pay a lower price, increasing demand.
Price Effects: The vertical distance between the supply and demand curves equals the subsidy amount.
Welfare Effects: Producer Surplus, Consumer Surplus, Government Cost
Subsidies increase total welfare but at a cost to the government. The gains are distributed among consumers and producers.
Producer Surplus: Increases due to higher prices received.
Consumer Surplus: Increases due to lower prices paid.
Government Cost: The rectangle representing subsidy paid on each unit sold.
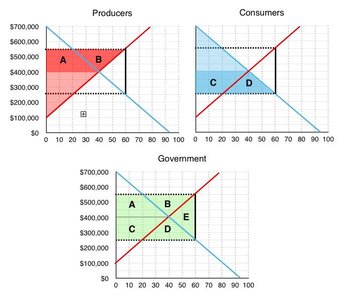
Area Analysis in Subsidized Market
Diagrams can be divided into labeled areas to analyze welfare changes for producers, consumers, and government.
Producers: Areas A and B represent increased producer surplus.
Consumers: Areas C and D represent increased consumer surplus.
Government: Areas A, B, C, D, and E represent total government expenditure.
Key Formulas
Tax Revenue:
Deadweight Loss:
Subsidy Cost:
Summary Table: Effects of Taxes and Subsidies
Policy | Supply/Demand Shift | Price Paid | Price Received | Quantity | Welfare Effects |
|---|---|---|---|---|---|
Tax | Supply up or Demand down | Increases | Decreases | Decreases | CS↓, PS↓, Gov Revenue↑, DWL↑ |
Subsidy | Supply down or Demand up | Decreases | Increases | Increases | CS↑, PS↑, Gov Cost↑ |
